As shown in previous blog posts in the Multi-Language Verification Environment series, creating multi-language verification environments is not difficult. Using UVM-ML, we can pass data between components via TLM ports, instantiate e components within SystemVerilog (and vise versa), and configure the sub-components – independent of the verification language they are implemented in.
But the real challenge, like with most of the verification tasks – is debugging. As we know, verification engineers spend most of their time not on coding, but rather, on debugging.
This post targets three main debugging tasks:
- Browsing the data in a multi-language environment
- Debugging configuration failures
- Debugging data transfer on TLM ports
Data Browsing in a Multi-Language Environment
The first step when we come to debug an environment is typically – look at it, browse it. Then, we see what components were created and verify that we “got what we wanted."
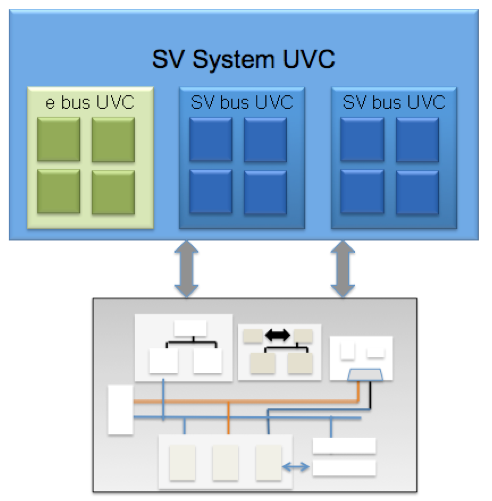
For browsing the environment, e users normally start with a “print sys” command or open the data browser window – showing sys as the top unit. This has two flaws when working in a multi-language environment. First, it shows only the e units and not the full environment. The more serious drawback is with the e units that are instantiated under SystemVerilog. Assume this environment, for example:
In this environment the e UVC is instantiated under a SystemVerilog component and not under sys. The print sys command will not print this UVC component.
For printing all e units, including those instantiated under SystemVerilog components, you can use the show units command in Specman. This command prints all e units instances in the environment – those that are instantiated under sys and those that are instantiated under SV or SC components. The below screenshot demonstrates the result of show units, in an environment in which a unit of type env is instantiated in uvm_test_top, with instance name vip_top. This unit contains two sub units, named producer and consumer.
To see the details of vip_top, you can pass env-@2 to the data browser.
For seeing the whole structure – all of the components, in all languages – we can use the IES uvm_ml_print_tree command, available since UVM-ML 1.5. This command presents the full hierarchy – e unit, SV UVM components, and SC UVM components – in ASCII format.
An environment of the SystemVerilog component named tb containing an e unit named xbus_uvc, is presented by uvm_ml_print_tree like this:
Debugging Configuration Failures
As we saw in the previous blog, UVM-ML supports multi-language configuration, constructed with procedural config set/get, based on strings. For the configuration to take place, the sub-component should get the configuration. This technique has two potential risks –
1. There is a mismatch in the string, due to human error. For example, if one writes:
uvm_config_int::set(this,"*xbus_config","min_addr", 10);
while the field name is not min_addr, but rather addr.
- The sub component does not call config get
Currently, configuration debugging has two different tools, each tracing configuration activities in one language.
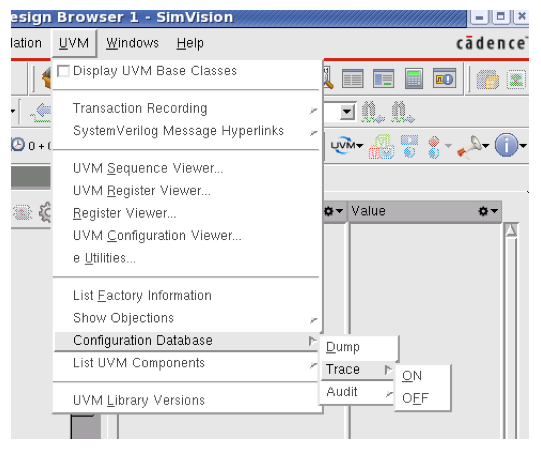
For tracing configuration set/get done in SystemVerilog code, you can use SimVision UVM Debugger, or the default UVM command line option +UVM_CONFIG_DB_TRACE.
Until e configuration activities are also handled by the UVM Configuration Database, you can use the Specman command trace uvm config, available from Specman version 15.1. It prints to the screen all calls to uvm_config_set() and uvm_config_get() -
[trace uvm_config] topenv.inst1: uvm_config_set("u1", "data", 0x73DF) done outside Specman
[trace uvm_config] agent-@15 tovenv.inst1.my_e_agent: uvm_config_get(data) done at line 10 in @my_agent, value is 1375
This command can help identifying basic configuration failures – a “mismatch." Configuration was set, but get() was not called.
Debugging Data Transfer on TLM Ports
The last debugging challenge I’ll discuss in this post is transferring data items between components. A buggy behavior we all have to debug, from time to time, is when the checker informs of a data mismatch in a data item it got from a monitor. The question is then, where is the bug? Is it indeed a DUT bug, or is it a bug in the monitor that collected the item? It may be that the bug is in the interface – the monitor writes one thing on the port, but the checkers get a different thing.
For debugging, the way items pass on the ports between components, there are few tools. First, we want to verify that the two ports – the monitor’s and the checker’s – are connected to each other. We can view all the ports in the environment, using uvm_ml_print_tree –ports. We can also use the uvm_ml_print_connections command, available from UVM-ML 1.5 – getting the list of all ML connections in the environment.
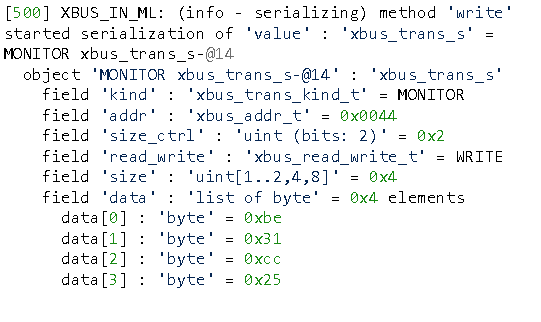
For seeing the activity on the e side of the port, we can issue Specman trace ml_ser command. This command shows the exact data that is being written on a port. For example:
UVM-ML is being enhanced constantly, adding debugging capabilities. As we all know, debugging is our biggest challenge.
Happy Debugging,
Efrat Shneydor


