One of the famous quotes of Brian Kernighan is: "Debugging is twice as hard as writing the code in the first place. Therefore, if you write the code as cleverly as possible, you are, by definition, not smart enough to debug it". Well, I am not really sure he meant that no one is smart enough to debug one’s own code; however, he did mean that debugging is hard, if not even harder than coding. Hence, you want to get any help you can to make your debugging easier and more effective. If you feel you have room to improve the efficiency of your debugging, this blog is for you.
Let’s assume that you find yourself debugging your testbench while you are working on a large design. If it is a tricky one, you might need several cycles of debugging to get to the bottom of it: You assume the problem resides in your testbench, and you might even have a pretty good idea of where in the code the problem is. However, in each cycle of debugging, to get to the point where you want to break, you must wait quite a while for the simulation to reach to that point. And while you wait for the simulator to do the exact same things each time… well, yes, there is coffee in the kitchen, and true, you probably have good context switch abilities so that you can spend your time on other things rather than just sit and wait, but… let’s agree it is annoying to wait when you want to move ahead.
For this purpose, Specman introduced the Record and Replay feature several releases ago. Using this feature, you run the simulation once in record mode, where Specman records all the activity on the interface between the simulator and Specman. From this point, you can rerun the simulation in replay mode. In replay mode, the simulator does not run the DUT; rather, when Specman needs to interact with the simulator, it just reads the data from the recorded database. The simulator still needs to be present in replay mode; however it stays at time 0.
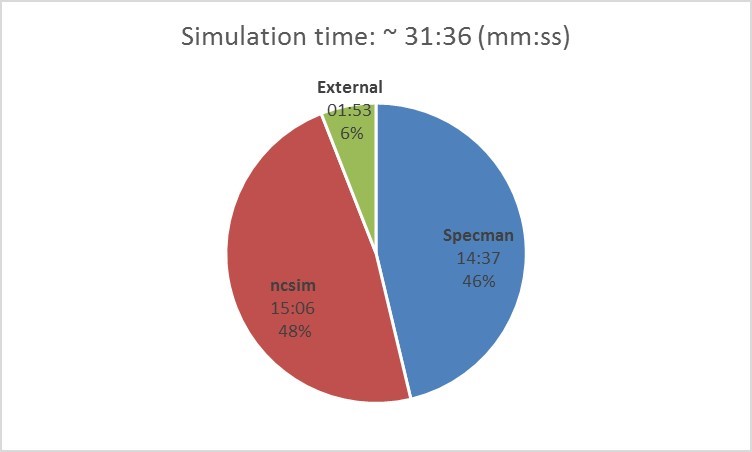
Let’s take an example from a real-life scenario. We have a design in which there is a false DUT error reported in one of the last packets, meaning late in the simulation, and in debugging the checker, you need to stop few times along the way. The simulation takes 31:36 (mm:ss) and in this case, the simulator takes a significant portion of the simulation run. To be more precise, I ran it once with Cadence Advanced Profiler (referred as iProf; if you haven’t used it yet, you can read about it here). The results are shown in the following diagram.
ncsim took 48% of the cpu time, which means about 15 minutes. This means that if I am not interested in debugging the RTL code but rather I am only interested in the e code, whenever I run the simulation, I waste a redundant 16.5 minutes.
 Recording the data (or: “let the simulator work”)
To record the interaction with the simulator, I need to run it once in record mode. There are various ways to do so; however the easiest one is just setting the environment variable:SN_RR_MODE to “record” and run the simulation.
setenv SN_RR_MODE record
At the end of the run, all the recorded data is kept in a default location.
 Debugging in replay mode (or: “let the simulator rest…”)
After I recorded the data, I can run my test in replay mode, which means that whenever Specman needs to interact with the simulator, it will read the recorded data instead. To run in replay mode, I simply need to change the value of the environment variable SN_RR_MODE to “replay”. I don’t really need to bother myself with the location of the recorded data, Specman will read it from the default location.
setenv SN_RR_MODE replay
Can you guess how long the run in this replay mode took?
The simple math should yield:
31.5 min (the whole run) minus 15 min (eliminated ncsim time) = 16.5 min
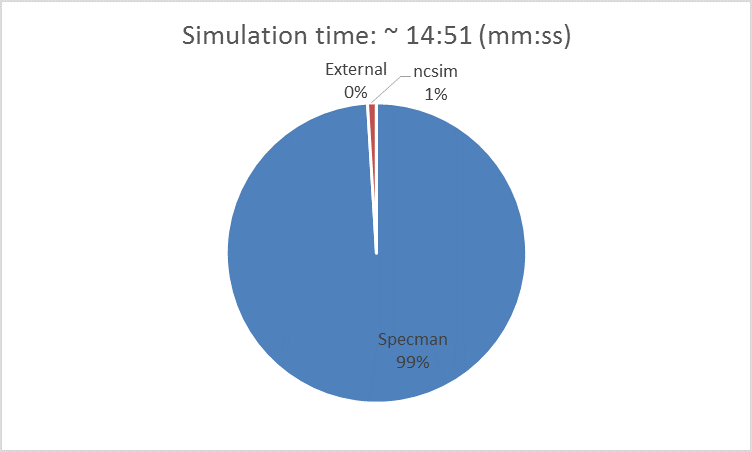
However the true results are even better; it took only almost 15 minutes. This is because I also saved on the “External” processing activated through ncsim (that we saw in the previous diagram). From Specman’s perspective, this is part of the interaction with the simulator, so it too was recorded. The “External” processing had lasted almost 2 minutes, however only 1.5 minutes was saved because reading data from the database during replay had a .5 minute overhead.
As you can see in the following diagram, when I ran iprof again for the sake of this blog, Specman accounted for almost 100% of the run.
When you want to leave this mode of Record and Replay, don’t forget to reset the value of SN_RR_MODE to “”. However, don’t worry, in both record and replay modes, you get a clear messages about their existence.
If you have a long simulation run in which the simulator itself takes significant time and you want to debug only the test bench itself, it is advised to check out the Record and Replay feature. You can read more about this feature in Cadence help.
Orit Kirshenberg, Specman R&D

