Are you busy debugging your environment topology and coming up against components getting unexpected data? Have you found yourself asking “who is passing data to this monitor, and why?”?
Components in the environment interact using ports (TLM ports, method ports, simple ports, and so on). This blog tackles the challenge of debugging a “bad connection”—an in port bound to the wrong out port. When you realize that there is probably something wrong in the ports connections, you need to:
- Find the bad connection.
- Find the buggy code.
- Fix the code.
In the rest of this blog, we will illustrate some tools that can help you perform this task.
Let’s assume that a checker issues a DUT error, and in the debugging session we see that the data item it received is suspicious. In our scenario, the data is written to the checker via a TLM port. Our first task is to track the origin of the buggy item—that is, to discover which monitor is connected to this port.
Finding the problematic port or “Where is the problematic port?”
Our first recommendation is to check the port bound set (the set of ports that are bound to the TLM port). You can do this by using the show ports –full command, printing the port instance, or calling the get_bound_set() method of any_port. All of these options print port information that includes what we need for the debugging task at hand—the port’s bound set.
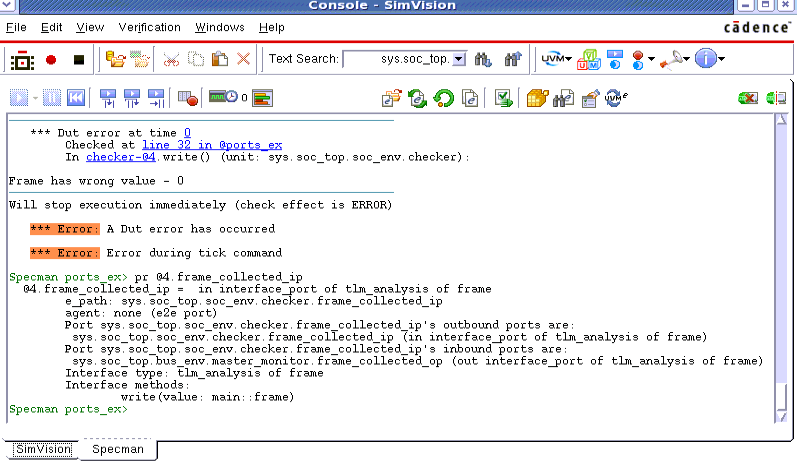
Here is a screen shot that shows the results of printing the TLM port instance after the checker fires a DUT error:
Our first debugging task is complete—we see from the printed results that the checker in port is connected to the out port of the master_monitor. This explains the buggy DUT error—the checker should be connected to the slave_monitor, not the master_monitor. So now we are ready to perform the second debugging task—find where the connection is made in the code so that we can fix it.
To see where the erroneous connection is made, we have to run the test again and trace the binding.
Binding can be done procedurally, that is with calls to do_bind() or to connect(), or declaratively, that is defined with keep bind constraints. The following examples show how to trace both kinds of binding.
Finding the problematic connection or “Where is the problematic connection done?”
To trace procedural binding, we use the trace bind command:
Specman> trace bind
Specman> gen
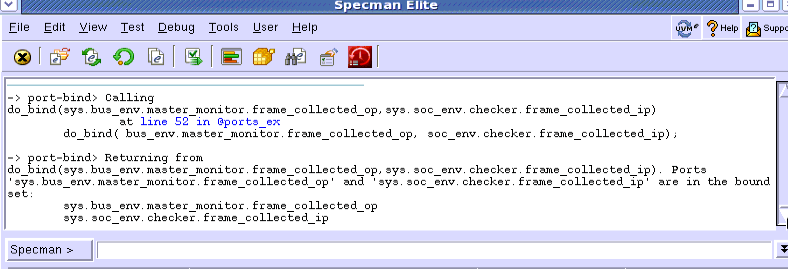
After issuing the trace bind command, all procedural binds are printed to the screen. In the following example, we can see from the trace that the checker in port is bound with the do_bind() procedural binding action:
Finding the problematic declaration or “Where is the problematic declaration?”
Declarative binding (with keep bind constraints) is executed as part of the generation phase. To trace those constraints, you need to call the trace gen command, rather than the trace bind command.
Specman> trace gen
Specman> gen
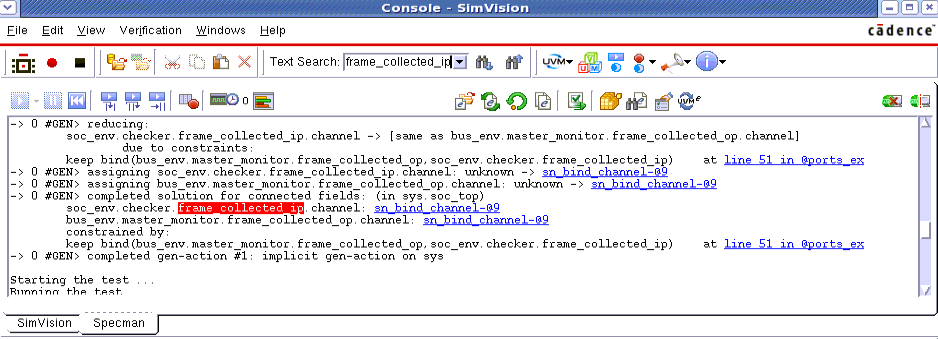
After generation is completed, we can use the Text Search in the SimVision Console window to display the generation of the given port:
In this example, we can see from the trace that the checker in port is bound with a keep bind constraint. Just like the previous example, the trace shows the line number and file where the binding takes place.
Our debugging task is complete—we can now edit the file, go to the line number, and fix the binding to bind the checker to the right monitor.
We hope this debugging demonstration will help you fix your wiring errors and save you debugging time.
By: Efrat Shneydor and Reuven Shenkar (Specman Team)


