Quantcast
Channel: Cadence Functional Verification
Viewing all 670 articles
Browse latest View live

My First Internet of Things Device: Moving from a Manual to an Automated Process—Debug Analyzer vs. Simple Logging

$
0
0

The Internet of Things (IoT) has been a buzzword for quite some time now. However, thus far it has not seen wide adoption or market penetration in the home; this, at least, has been my observation. And, in my circle of friends, hardly anyone has adopted any home IoT devices.

Some have flirted with the idea of buying devices like the Nest advanced thermostat, now owed by Google. However, they have not pulled the trigger and actually bought any. 

Although I typically tend to be on the early adopter side of the bell curve when it comes to technology adoption-and I believe IoT will be big--I did not have a compelling reason to get into the game with devices for my home, at least until now.

However, when I sat down and connected the dots, I realized that I have a perfect application for an IoT device.

Many parents out there have experienced similar phases in the"going to bed" habits of their kids. My youngest son is in the phase of: Can't go to bed without the light on.

He just traded with his older brother, who no longer has this problem. However, the light my little one "demands" cannot merely be a nightlight. It has to be a fairly bright light to satisfy him.

Obviously, I do not want to have the light on all night for two reasons:

  • It is not good for his sleep
  • It is a waste of energy (even though I use CFLs)

Hence, the typical nighttime drill is this:

  1. Potty time (use the toilet for you non-US folks out there)
  2. Teeth brushing
  3. Storybook reading
  4. Waiting until he is in a deep sleep and returning to shut his light off

This routine works pretty well, but sometimes turning the light off wakes him up. There ought to be a better way, and there is.

The other night I was too tired to walk over to turn off his light. But I still did it.

However, I thought that this is too stupid a method to be using in 2014 - I needed to automate this process. So I searched around and found a smartphone-controllable LED light bulb for his room with the associated controller hub! Specifically, I got the TCP Connected smart lighting system. 

The experience was amazing. The hub setup was trivial and the app is very user friendly. You can witness my first test in the video below.

Besides the buzz and the general interest in the space, IoT in general and home automation in particular, it's not just marketing hype--there are serious dollars behind it. One recent example is the $90M cash infusion into a company called Savant. Further on, Apple announced an API for this space called HomeKit at their developer conference in June.

It seems that home automation with IoT devices is about to take off.

However, one of the challenges to IoT home automation adoption is that old habits are hard to break. Even I, typically an early adopter of technology, sometimes get stuck in old and inefficient ways of performing a task. To this day I still tend to use vi when editing code on Linux-It is my default mode of operation.

And, while I am fully aware of the advantages in editing e or SystemVerilog code using an IDE such as Eclipse, particularly when it is extended for the use of HVLs with DVT, it still takes a special effort to move away from such true and trusted approaches in order to gain additional automation and productivity.

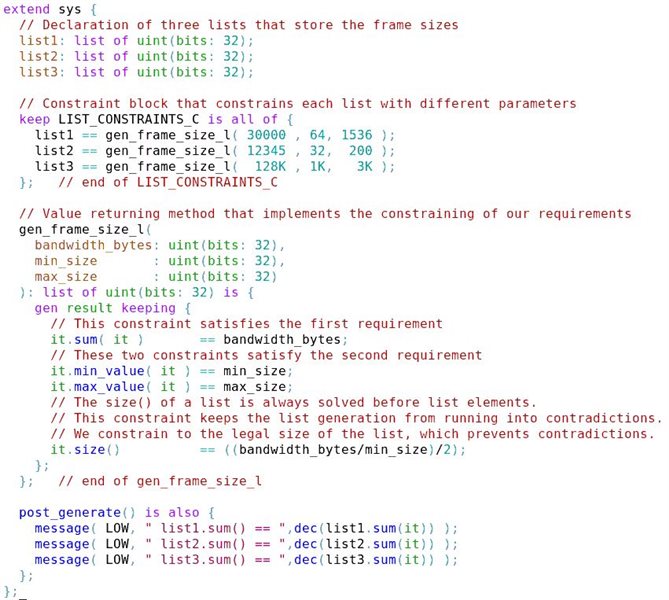
Many design and verification engineers follow similar habits. For example, when debugging code they spike it with lots of print statements and then peruse the resulting log file.

There is nothing wrong with this approach in and of itself--it is a classic and trusted method that gives the developer the information he or she wants, while being productive.

However, since code is getting continually more complex, like HDLs mixed with HVLs and so on., one quickly gets caught up in what can appear to be an infinite iterative loop. For example, because of a log message A, the developer now needs additional information, such as the value of a variable B, and so on. Consequently, the code has to be edited and re-edited, and the simulation has to run again and again.

With a small verification environment, such iterations can be fairly quick. However, at a complex sub-system level, such iterations might take several minutes, or even hours, which can add up very quickly to a lot of frustrating wait time. 

Besides frustration and wasted time, debugging iterations like this can also reduce productivity in other ways. Debugging is a very complex and intellectually demanding task. Any interruption or wait time will reduce the debug progress. The person debugging has certain thoughts and assumption she uses in determining the cause of a failure. If it takes a long time to get answers to these assumptions, then the debug productivity is adversely affected. In other words, the human idea caching is reduced.

It is exactly for this reason that Cadence introduced Incisive Debug Analyzer.

With Incisive Debug Analyzer, large portions of the productivity problems inherent in iterated debugging are addressed. Many of the debug iteration loops are cut out of the process altogether. One still needs to annotate the code with debug messages. But those messages become smart log messages.

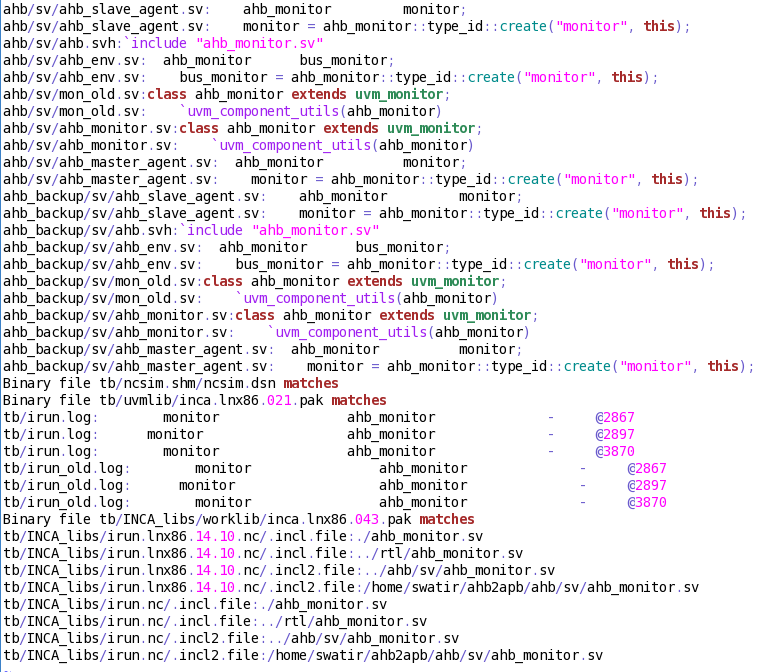
A smart log message is an advanced log message that can come from multiple sources, be it HVL such as e [IEEE 1647] or SystemVerilog [IEEE 1800], HDL, C, C++ or even assertions.

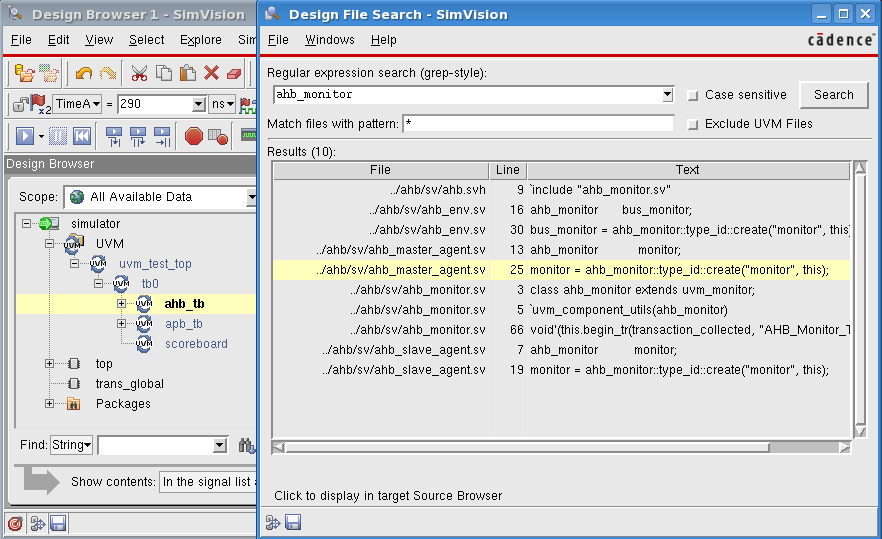
A powerful feature of Incisive Debug Analyzer smart logging is that it allows you to change the verbosity level of log messages without having to re-run the simulation. Incisive Debug Analyzer contains numerous other features that let you interact with log messages to hone in on the root cause of a bug more quickly. Smart logs are also synced up with the waveform database, providing a consistent view of the current simulation time.


In addition, Incisive Debug Analyzer enables effective interactive debugging. For example, assume you are stepping through a simulation and you halt using a breakpoint. If you now advance the simulation accidentally, or if you halted because of a wrong assumption, you might have to start the simulation all over again.

With Incisive Debug Analyzer, however, you can move both forward and backward through simulation time, reducing many simulation runs. You can do this because the HVL and HDL code is not being simulated. Instead, recorded values in the Incisive Debug Analyzer database are being stepped though. Consequently, the execution through time is orders of magnitude faster than in a live interactive simulation.

These are just some of the ways Incisive Debug Analyzer can help your debug process. For a full description, check out this link.

Bottom Line: Incisive Debug Analyzer can increase your debug productivity by automating a classic and manual debug process.


Long live efficiency!


Axel Scherer

Incisive Product Expert Team

Twitter, @axelscherer 


Troubleshooting Incisive Errors/Warnings—nchelp/ncbrowse and Cadence Online Support

$
0
0

I joined Cadence in July 2000 and was immediately put on a three-month training to learn and understand the simulator tools. There were formal training sessions, and I had a mentor who I could ask all my queries. But most of the times, I was on my own, as "learning by doing" was the motto of my mentor. Today, after completing 14 years at Cadence, I can tell you that it works great, especially in cases where the tool is also designed with great utilities that help you learn faster.

nchelp

As I moved on in my job, I faced time crunch in going through product manuals, LRMs, etc., and learning the basic stuff. Since time was less, I decided to write designs and start debugging myself to learn faster. In the process, I soon figured out a great self-help utility called nchelp—the native Help for Incisive simulation Error and Warning messages.

The nchelp utility gives you detailed information about an error or warning message that you may get during the various phases of your Incisive simulation run.

Here is the nchelp usage syntax:

nchelp <tool name> <error/warning code>

Let us take the following warning message as an example:

ncelab:*W,SDFNEP: Failed Attempt to annotate to non-existent path (COND (B===0) (IOPATH A Y)) of instance test.i1 of module xo2 <./a.sdf, line 20>.

Where,

ncelab is the name of the tool which generated this warning.

W indicates the severity of the message, (other levels of severity are Note (N), Error (E) or Fatal (F)), and

SDFNEP indicates the error or warning code. In this case "ncelab", the tool name is followed by the severity of the message

To get extended help for this warning, give the following command on your unix prompt:

% nchelp ncelab SDFNEP

ncelab/SDFNEP =

This path, including the condition, if any, does not exist in the instance being annotated. The requested annotation will not occur. In order to perform the annotation, the information in the SDF file must be updated to correctly match what is in the HDL description.

Now, if you combine the warning message,

ncelab:*W,SDFNEP: Failed Attempt to annotate to non-existent path (COND (B===0) (IOPATH A Y)) of instance test.i1 of module xo2 <./a.sdf, line 20>)

that gives me information on code, line number, etc, and the elaborated description through nchelp, I now know that I need to check the syntax mismatch for (COND (B===0) (IOPATH A Y)) in my HDL and SDF descriptions.

Similarly, there are thousands of such error and warning messages that can be debugged using nchelp.

For more information, I can refer Using theIncisive Simulator Utilities book available under the latest INCISIV Release documentation on Cadence Online Support by visiting http://support.cadence.com, or by looking through the CDNSHelp utility.

ncbrowse

Soon, I discovered the other great utility in its GUI incarnation called NCBrowse Logfile Message Browser.

ncbrowse is a two-window GUI that allows you to interactively view and analyze:

  • Log file messages produced by Cadence tools, such as the HDL analysis and lint tool (HAL)
  • Logs produced by other Cadence simulator tools, such as ncvlog (the Verilog compiler), ncvhdl (the VHDL compiler), and ncelab (the Incisive elaborator).

ncbrowse displays log file messages in a message window, and the corresponding Verilog source code that produced the messages in a source file window.


For more information,see the Using the Incisive Simulator Utilities book available under the latest INCISIV Release documentation on Cadence Online Support by visiting http://support.cadence.com, or by looking through the CDNSHelp utility.

Troubleshooting

And what a bonus when I started finding useful information, debugging tips, and learning collateral on the Cadence Online Support homepage, (http://support.cadence.com), which is the 24/7 partner for Cadence customers and employees. The information available on the support site not only helped me in resolving issues related to Cadence software, but also helped me in understanding Cadence tools and technologies better. You can find interesting articles, quick videos, training material, application notes, etc. on the support site that can be used as a quick reference.

To quote an example, after searching completely through NCHelp for information on the SDFNET warning, I wanted additional tips or scenarios. It is then, that I searched on http://support.cadence.com, and found a good article with details that I needed, and which also provided information on SDFNEP, a warning similar to SDFNET (SDFNET or SDFNEP messages, causes and cures).

I also remember a time when my simulation failed/crashed due to an internal error, and it required some deep diving or interactive learning to understand the cause of the failure. I found good debugging tips in the book Debugging Fatal Internal Errors, available on http://support.cadence.com. After reading through this book, I was able to narrow down on my issue and I also provided relevant inputs to development team to fix it.

So, to summarize, I always use these great self-help utilities, in the following order, whenever I need to troubleshoot any Incisive error or warning.

  1. Use NCHelp or NCBrowse to find detailed information on an error or warning message.
  2. Search Cadence Online Support by visiting http://support.cadence.com for any additional information.
  3. Contact expert or submit a case by visiting http://support.cadence.com -> Cases -> Create Case option.  This will report your case to the Technical Support team of Cadence. 

Happy Troubleshooting!

Sumeet Aggarwal

Transferring e "when" Subtypes to UVM SV via TLM Ports—UVM-ML OA Package

$
0
0

The UVM-ML OA (Universal Verification Methodology - Multi-Language - Open Architecture) package features the ability to transfer objects from one verification framework to another via multi-language TLM ports. Check out Appendix A if you are a first-time user of UVM-ML OA.

This feature makes many things possible, such as:  

  • Sequence layering where one framework generates the sequence item and the other drives it to the DUT bus
  • Sequence layering where one framework invokes sequences in the other so that both item generation and DUT bus driving is done from a single framework
  • Monitoring the DUT using a different framework and still obtaining a scoreboard in a single framework
  • And more...

An issue arises when the object that we want to send via the TLM port is an e "when" subtype, since other frameworks do not have such type determinants. This will probably cause a type mismatch between the two frameworks that will probably be expressed by unpacking less/more bits than packed.

The recommended solution is to use the Incisive mltypemap utility, which automatically maps the specified data type to its equivalent representation in the target framework.

However, mltypemap currently does not support e "when" subtypes in terms of creating a different individual type in the target framework for each "when" subtype. Instead it creates one type that contains all of the fields from all "when" subtypes, including their determinants.

Therefore, after using mltypemap, you should use the determinants to determine which "when" subtype was received by the TLM port and extract only the relevant portion of the received object.

Example:

1.Suppose we want to send an e struct called "packet" from e to SV via a TLM put port. "packet" has two "when" subtypes: SINGLE and DOUBLE. The "when" subtype determines how many data fields this packet has (in this case, one or two). Note that there is no need to mark the fields as "physical". Mltypemap will automatically define them as physical unless told otherwise.

 The packet definition is as follows: (file name: packet.e)

Since the packet is sent to SV, an equivalent representation in SV must be defined for it. Therefore a mltypemap TCL input file needs to be created, that will:

  1. Configure the generated code to be UVM ML OA compatible
  2. Provide the source type
  3. Provide the target type name
  4. Provide the target framework 
  5. Optional - you can decide which fields will not be mapped by using config_type  ... -skip_field

This is how the TCL file maptype_to_sv.tcl should look:

 This TCL input file should be used with the mltypemap utility together with the e source file:

3. Three files were generated as a result of this command: packet_ser.e, packet.svh, and packet_set.sv. Be sure to include these three files in the source file list. The packet_ser files determine which fields to serialize/deserialize (you may have chosen to omit some fields from being serialized  by using the TCL config_type command with the -skip_field option). packet.svh includes the new type's definition in SV : (file name : package.svh)


 Note that the "when" subtypes are incorporated into the field's names. For example, the field "data_1" in the e "when" subtype DOUBLE't packet is represented here as ‘DOUBLE__t__data_1'. We will use this information when we fetch the data from the TLM implementation of our TLM put imp.

4.      Now suppose we want to send different "when" subtypes of the same type through one TLM port, we would have to define the TLM port in both frameworks.

Output port put_port in the e side (File name:  producer.e ): 

 And in SV, we define the input port, put imp (file name: consumer.sv):

 The TLM put imp must be registered with the backplane, and must also be connected to the e TLM put port. Suppose our hierarchy in SV is uvm_test_top.sv_env.cons.put_imp , and in e it is sys.env.prod.put_port. Then the registration and connection will be as follows (done in uvm_test_top, file name: test.sv):


5. In SV, the can_put and try_put functions and put task of the TLM put imp port will need to be defined in order to determine whether we have a SINGLE't packet or a DOUBLE't packet (file name : consumer.sv): 

 The above example shows how to send a struct that represents a data item, but the proposed solution could also be applied to other functionally directed struct types, like sequences.

Suppose we would like to send some sequences from a sequence library in e to be started in SV. All we need to do is map the e sequence library to SV using the mltypemap utility, and then in the SV code, determine which sequence was received from e, extract its relevant fields, and start the equivalent SV sequence with the fields that were extracted from the received sequence struct.

This solution enables users to use TLM ports to send e "when" subtypes to the target framework. The ability to use TLM ports has many advantages over previous solutions, such as  independence frpm a stub file, and the ability to connect the same port to different languages by only changing the UVM path. 


Appendix A: Applying the UVM_ML_OA Features If Previously Unused in Your Multi-Language Environment

If you did not previously use the UVM_ML_OA features in your multi-language environment, apply them to the environment as follows:

  1. Download and untar the UVM ML OA package from uvm world from here . You will need to register if you are not already registered.
  2. Set the environment variables and source the setup.csh script (as explained in README_INSTALLATION.txt) which is located in the ml/ folder in the untarred folder.
  3. In the file that contains your top module (the module that instantiates the DUT and that includes your UVM sv VC and the uvm_pkg packages ), do the following:

a.  Import the uvm_ml package: 


 b.  In an initial block, create a string array, where each string points to the top-level entity of each framework in your environment. (In the example below, it is is only the e test file.)

 c.  Replace the run_test() statement with uvm_ml_run_test(). Provide uvm_ml_run_test() with the string array from the previous step and with the SV test name. (In the example below, the SV test is also the top entity in the UVM SV framework.)


For more information on UVM ML OA constructs, syntax, and other features, go to the UVM ML OA documentation in <uvm_ml_install_dir>/ml/README.html

e and SystemVerilog: The Ultimate Race

$
0
0

For years we've watched the e and SystemVerilog race via countless presentations, articles, and blogs. Each language is applied to SoC verification yet the differences are well documented so any comparison is subject to recoding from one language to the other. This makes a direct performance comparison difficult to measure. Until now.  

On April 21, 2014, SystemVerilog and e toed the line for the first direct SoC race. They were set-up in a long-pole test to allow each language sufficient run-time to establish the test as credible. As you can see at below, e started very strong and got out to an early lead. A moment later, SystemVerilog surged to the lead as shown in the next screen capture. This exchange continued relentlessly from Hopkinton deep into the Newton Hills. As the race continued it was just obvious: e and SystemVerilog are joined at the hip and this is a multi-language race. The only way to finish this race was to have the two languages work together. Turning onto Boylston St. and charging across the line, e and SystemVerilog finished the SoC (Sherilog on Course) together.

As much fun as this blog was to write, it was more important to take part in this race.  I am proud to have helped make a statement along with nearly 32,000 others in my 9th Boston Marathon.  I was also able to raise more than $5000 with my patient-partner Linda as I ran for the Boston Children's Hospital.

=Adam Sherilog 

PS: If you are interested, you can donate to our Children's Hospital Team through the end of May. 


Pretty Fly For an Old Feature—Discovering Existing But Unknown Incisive Verification Features

$
0
0

It is the year 2014. We live in a highly mobile, wireless world, supported by cloud and associated network infrastructure. Therefore, the use of physical media, such as CDs, DVDs, BlueRay discs, and so on are fading quickly.

Personally, because of the early adopter in me, I despise the use of physical media in this day and age. The few interactions I still have with it are limited to the use of CDs in my car, as the aux input connection is electrically noisy, and the Bluetooth interface does not support my smartphone for some reason. Mind you, my car is a model that is at the end of its lifecycle. This means the engineering for it was developed many years earlier. The average automobile development cycle is about 7 years, and mine was originally released in 2003. Hence, in the worst-case scenario, the audio system was selected and developed around 1996. Most likely it was updated in model years thereafter. However, it would make sense that for my model, besides the FM/AM radio, the main audio source is Audio/MP3 CD.

 A few weeks ago, the following song popped into my head: "Pretty fly (for a White Guy)" by The Offspring, which is some sort of Punk-Rock-Pop song that was popular in 1998. It is a pretty funny song. I bought it and my kids started to love it. This meant that they demanded I play it in the car for them.

(Please visit the site to view this video)

So, I had to burn a CD. I have not done that in years and was surprised that I even still had writable CDs in the house. 

I burned the CD with one other song just a few minutes before I drove my kids to a soccer game. In the rush, I did not add more songs to the playlist to complement "Pretty Fly", so we had to listen to the two songs over and over again. Eventually, I got sick of it. Hence, I used the genius feature in Apple's iTunes to create a more interesting and longer playlist. Then I burned a new CD with about 15 songs. Fifteen songs are good, but even that will also get stale sooner or later.

Why don't I go ahead and burn even more songs on a disk, you may ask? Hey, I could make an MP3 CD, which has far greater storage capacity that the old audio CD format. And if I recall correctly, my car's disk player does support the MP3 audio format, whichispretty exciting to me! So, I burned a disk with about 150 songs.

I could not wait to put the MP3 disk into the car's disk drive and check if it worked. Unfortunately it did not! Hence I could not fight the staleness factor yet. Even worse, I could not expose my kids to more gems of '90s or dare I say '80s and '70s music ;) But then I ran into a store and they had a nice 3.5mm to 3.5mm standard mini jack cable. In a moment of clarity I thought, maybe the aux noise is from the cable I have. And indeed that was the case. Obviously I should have debugged this years ago.

The point I am making is this: We all use tools and devices that have features that we kind of know about, but are not fully aware of, or have never used.

The same is true, of course, for verification in general, and Incisive in particular. When we talk to Incisive users, we often see the following interaction taking place:

Application Engineer: "Did you try feature X yet?"

Customer: "Never heard of it." (Or they have heard of it, but never used it)!

Application Engineer: "Feature X provides the following functionality and could be used in the following way."

Customer (tries feature X): "This is great stuff. I cannot believe I missed out on this for so long."

In order to give you a whole set of features that you might not have used yet, I have collaborated with other members of the Incisive Application Engineering, Product Expert, and R&D team to compile a list of 10 features likely to be unknown by many Incisive users.

1. Waveform database probing with -event: Debug race conditions related to event ordering.

2.  Design file search: Find files associated with your debug session quickly.

3. iprof (Incisive Performance Profiling):The ability to perform Advanced Profiling for SystemVerilog, UVM, RTL, GLS.

4. nchelp/ncbrowse: Two utilities to help you get more details about Error or Warning messages, combined with a browser to make message analysis easier.

5. IEEE 1801 (aka UPF) Power Supply Network Browser: The easy way to debug your UPF power supply network.

6. Quick diff in the waveform viewer: A fast way to detect unexpected signal differences.

7. UVM Sequence Viewer: Making sense of UVM sequences and their hierarchy.

8. Cloning of SystemVerilog randomization calls: Ability to extract the relevant code related to a randomization call.

9. Test Case Optimizer: Trimming down a testcase to a small fraction of it size to recreate an issue: Error, Warning etc.

10. Automated Transaction recording and viewing for UVM: Quickly turn UVM sequence activity in visual transactions.

We will release specific posts for all of these features in the upcoming weeks.

By the way, I disagree with the line in the song "the world loves wanabees." It might have been meant in an ironic way, but the world loves the real deal.

Keep on discovering unknown features!


Axel Scherer

Chief Fly Guy

Generic Dynamic Runtime Operations With e Reflection - Part 3: Additional Capabilities and Conclusion

$
0
0


This post concludes the series of blog posts that discuss the dynamic capabilities of the Reflection API in ePart one described the basics of generic value assignments and retrievals, using untyped and value holders. Part Two explained how to manipulate field values and invoke methods in a generic manner. If you have not read those two blogs and are not familiar with those concepts yet, I strongly recommend reading them before reading the rest of this post. 

In this post, we'll take a look at a couple of additional reflection methods, and see an example that makes use of several features described in this blog series.

As described in the previous posts, you can use untyped variables or value holders to store values of unknown types and retrieve them. But how can you print such a generic value or convert it to a string? And how can you, given two generic values, compare between them?

Using the print action or one of the output-producing constructs such as out() or message() with untyped values directly will not achieve the desired effect. Furthermore, passing untyped to routines such as out() is under deprecation and will be disallowed in future Specman versions. Using to_string() with such values is also disallowed. There is a good reason for this: Since an untyped variable does not "know" the actual type of the stored value, it also does not know how to correctly convert this value to a string or how to print it.

Similarly, comparing between two untyped values using the == operator does not do the job. Since the untyped variables do not know the actual types of the values (and do not even know whether their types are the same or compatible), they do not know how to compare. The comparison operator works differently with different types.

The following two reflection methods help solve these problems.

rf_type.value_to_string(value: untyped): string

This method converts the given value to a string, assuming that the value belongs to the type on which it is called.

rf_type.value_is_equal(value1: untyped, value2: untyped): bool

This method compares between the two values, assuming that both values belong to the type on which it is called, using the == operator semantics of that type, and returns TRUE if the values are equal.

With both methods, it is your responsibility to make sure that the untyped parameters actually store values of the given type. If that is not the case, the behavior of these methods is undefined, and may even lead to a crash.

The following example shows a method that gets two struct objects of an unknown type, compares between all scalar fields of these two objects, and displays a message if the values of some scalar field in the two objects are different.

compare_structs(first: any_struct, second: any_struct) is {


        // What is the type of the first object?

        var s: rf_struct = rf_manager.get_struct_of_instance(first);


        // If the second object is not of the same type - print a message and return

        if s != rf_manager.get_struct_of_instance(second) {

            outf("Types of %s and %s differ\n", first, second);

            return;

        };


        // Go over all fields of both objects, according to their struct type

        for each (f) in s.get_fields() {


            // We are only interested in scalar fields - skip others

            if f.get_type() is not a rf_scalar {

                continue;

            };


            // Retrieve the value of the field from both objects

            var first_f_val: untyped = f.get_value_unsafe(first);

            var second_f_val: untyped = f.get_value_unsafe(second);


            // Compare the two values, and if they are not equal, print a message

            if not f.get_type().value_is_equal(first_f_val, second_f_val) {


                // Use value_to_string() to print the actual values

                outf("Value of %s for %s is %s, whereas for %s it is %s\n",

                    f.get_name(),
                    first, f.get_type().value_to_string(first_f_val),

                    second, f.get_type().value_to_string(second_f_val));

            };

        };

    };

}; 


To conclude, the Reflection API in e allows you not only to make static queries about your code, but also to perform runtime operations in a generic manner. In addition to the reflection methods described in this blog series, there are more methods that allow operations on lists, checking whether a given field's value is consistent with its declared type (e.g., for when subtypes or scalar subrange types), checking whether a given constraint is satisfied by a given struct, and so on. For more information, consult Cadence online help, or access the Reflection API online documentation (in the eDoc format):
<you_incisiv_install_dir>/specman/docs/reflection_api_edoc/html/index.html
directly from your favorite web browser.


Yuri Tsoglin

e Language team, Specman R&D 

Generic dynamic run-time operations with e reflection Part II

$
0
0

Field access and method invocations

In the previous blog, we explained what are untyped variables and value holders in e, and how to assign and retrieve values to/from them. In this and the next blogs, we will see how they can be used in conjunction with the Reflection API, to perform operations at run time.

Normally, when you declare fields in your e structs and units, you then procedurally assign values to those fields at some points and retrieve their values at others. When you declare a method, you call it with certain parameters and retrieve its return value for later use. All of this is fine when you deal with a specific field or method, and that is what you need most of the time.

But what if you want to perform some generic operation? For example, you may want--given anye object (of any struct or unit type, which is unknown upfront)--to go over all its numeric fields and print their values. Or, you may want to traverse the whole unit tree, and on every unit whose type has a specific method (given by name), call that method and print its result.

The Reflection API allows us to perform tasks like that in a fairly easy manner. Here are some reflection methods which are helpful for those tasks. Given an instance object, the following two methods allow you to get the reflection representation of the struct or unit type of the object.

  • rf_manager.get_struct_of_instance(instance: base_struct): rf_struct

This method returns the like struct of the object, disregarding when subtypes.

  • rf_manager.get_exact_subtype_of_instance(instance: base_struct): rf_struct

This method returns the most specific type, including when subtypes, of the object.

For example, for a red packet instance, get_struct_of_instance() will return the reflection representation of type packet, and get_exact_subtype_of_instance() will return the representation of type red packet.

The following methods of rf_field allow, given an instance object of some struct, to set or get the value of the specific field of that object.

  • rf_field.set_value(instance: base_struct, value: rf_value_holder);
  • rf_field.set_value_unsafe(instance: base_struct, value: untyped);
  • rf_field.get_value(instance: base_struct): rf_value_holder;
  • rf_field.get_value_unsafe(instance: base_struct): untyped;

The set_value methods take the value passed as parameter, and assign it to the given field of the specified object. The get_value methods retrieve the value of the given field of the specified object and return it. There is a safe and an unsafe version of each method. The safe version uses a value holder, which already contains the type information for the value (as was explained in the previous blog), performs additional checks, and throws a run-time error in case of an inconsistency (for example, if the field does not belong to the struct type of the given instance). The unsafe version (the one with the _unsafe suffix) does not use a value holder and does not perform such checks; in case of an inconsistency, its behavior is undefined and might even cause a crash. Thus, you need to use it with a care. However, the unsafe version is more efficient, and I recommend using it when possible.

Similar to the above rf_field methods, the following methods of rf_method, given an instance object of some struct, allow you to invoke a specific method of that object or to start a TCM.

  • rf_method.invoke(instance: base_struct, params: list of rf_value_holder): rf_value_holder;
  • rf_method.invoke_unsafe(instance: base_struct, params: list of untyped): untyped;
  • rf_method.start_tcm(instance: base_struct, params: list of rf_value_holder);
  • rf_method.start_tcm_unsafe(instance: base_struct, params: list of untyped);

The invoke methods call the given method on the specified object and return the value returned from that method. If the given method has parameters, they should be passed as a list in the second parameter; the list size must exactly match the number of parameters the method expects to get. Similarly, the start_tcm methods start the given TCM on the specified object. As with the rf_field methods above, the difference between the safe and unsafe versions of these methods is that the safe one uses value holders and performs additional run-time checks, while the unsafe version is more efficient.

The following short example demonstrates the usage of the above methods. The following method gets an object of an unknown type (declared as any_struct) and a method name. It goes over all fields of the object whose type is int, and calls the method by the given name, passing the field value as parameter. For simplicity, we assume it is known that the method by the given name indeed exists and has one parameter of type int.

extend sys {

    print_int_fields(obj: any_struct, meth_name: string) is {

        // Keep the reflection representation of the int type itself

        var int_type: rf_type = rf_manager.get_type_by_name("int");

        // Keep the struct type of the object

        var s: rf_struct = rf_manager.get_exact_subtype_of_instance(obj);

        // Keep the method which is to be called

        var m: rf_method = s.get_method(meth_name);

        // Go over fields of the struct

        foreach (f) in s.get_fields() do {

            // Is this field of type 'int' ?

            if f.get_type() == int_type then {

                // Retrieve the field value ...

                var value: untyped = f.get_value_unsafe(obj);

                // ... and pass it to the method

                compute m.invoke_unsafe(obj, {value});

            };

        };

    };

};


In the next blog in the series, we will discuss some additional relevant reflection methods, give several tips, and look at some more interesting examples.


Yuri Tsoglin

e Language team, Specman R&D 

Transferring e "when" Subtypes to UVM SV via TLM Ports—UVM-ML OA Package

$
0
0

The UVM-ML OA (Universal Verification Methodology - Multi-Language - Open Architecture) package features the ability to transfer objects from one verification framework to another via multi-language TLM ports. Check out Appendix A if you are a first-time user of UVM-ML OA.

This feature makes many things possible, such as:  

  • Sequence layering where one framework generates the sequence item and the other drives it to the DUT bus
  • Sequence layering where one framework invokes sequences in the other so that both item generation and DUT bus driving is done from a single framework
  • Monitoring the DUT using a different framework and still obtaining a scoreboard in a single framework
  • And more...

An issue arises when the object that we want to send via the TLM port is an e "when" subtype, since other frameworks do not have such type determinants. This will probably cause a type mismatch between the two frameworks that will probably be expressed by unpacking less/more bits than packed.

The recommended solution is to use the Incisive mltypemap utility, which automatically maps the specified data type to its equivalent representation in the target framework.

However, mltypemap currently does not support e "when" subtypes in terms of creating a different individual type in the target framework for each "when" subtype. Instead it creates one type that contains all of the fields from all "when" subtypes, including their determinants.

Therefore, after using mltypemap, you should use the determinants to determine which "when" subtype was received by the TLM port and extract only the relevant portion of the received object.

Example:

1.Suppose we want to send an e struct called "packet" from e to SV via a TLM put port. "packet" has two "when" subtypes: SINGLE and DOUBLE. The "when" subtype determines how many data fields this packet has (in this case, one or two). Note that there is no need to mark the fields as "physical". Mltypemap will automatically define them as physical unless told otherwise.

 The packet definition is as follows: (file name: packet.e)

Since the packet is sent to SV, an equivalent representation in SV must be defined for it. Therefore a mltypemap TCL input file needs to be created, that will:

  1. Configure the generated code to be UVM ML OA compatible
  2. Provide the source type
  3. Provide the target type name
  4. Provide the target framework 
  5. Optional - you can decide which fields will not be mapped by using config_type  ... -skip_field

This is how the TCL file maptype_to_sv.tcl should look:

 This TCL input file should be used with the mltypemap utility together with the e source file:

3. Three files were generated as a result of this command: packet_ser.e, packet.svh, and packet_set.sv. Be sure to include these three files in the source file list. The packet_ser files determine which fields to serialize/deserialize (you may have chosen to omit some fields from being serialized  by using the TCL config_type command with the -skip_field option). packet.svh includes the new type's definition in SV : (file name : package.svh)


 Note that the "when" subtypes are incorporated into the field's names. For example, the field "data_1" in the e "when" subtype DOUBLE't packet is represented here as ‘DOUBLE__t__data_1'. We will use this information when we fetch the data from the TLM implementation of our TLM put imp.

4.      Now suppose we want to send different "when" subtypes of the same type through one TLM port, we would have to define the TLM port in both frameworks.

Output port put_port in the e side (File name:  producer.e ): 

 And in SV, we define the input port, put imp (file name: consumer.sv):

 The TLM put imp must be registered with the backplane, and must also be connected to the e TLM put port. Suppose our hierarchy in SV is uvm_test_top.sv_env.cons.put_imp , and in e it is sys.env.prod.put_port. Then the registration and connection will be as follows (done in uvm_test_top, file name: test.sv):


5. In SV, the can_put and try_put functions and put task of the TLM put imp port will need to be defined in order to determine whether we have a SINGLE't packet or a DOUBLE't packet (file name : consumer.sv): 

 The above example shows how to send a struct that represents a data item, but the proposed solution could also be applied to other functionally directed struct types, like sequences.

Suppose we would like to send some sequences from a sequence library in e to be started in SV. All we need to do is map the e sequence library to SV using the mltypemap utility, and then in the SV code, determine which sequence was received from e, extract its relevant fields, and start the equivalent SV sequence with the fields that were extracted from the received sequence struct.

This solution enables users to use TLM ports to send e "when" subtypes to the target framework. The ability to use TLM ports has many advantages over previous solutions, such as  independence frpm a stub file, and the ability to connect the same port to different languages by only changing the UVM path. 


Appendix A: Applying the UVM_ML_OA Features If Previously Unused in Your Multi-Language Environment

If you did not previously use the UVM_ML_OA features in your multi-language environment, apply them to the environment as follows:

  1. Download and untar the UVM ML OA package from uvm world from here . You will need to register if you are not already registered.
  2. Set the environment variables and source the setup.csh script (as explained in README_INSTALLATION.txt) which is located in the ml/ folder in the untarred folder.
  3. In the file that contains your top module (the module that instantiates the DUT and that includes your UVM sv VC and the uvm_pkg packages ), do the following:

a.  Import the uvm_ml package: 


 b.  In an initial block, create a string array, where each string points to the top-level entity of each framework in your environment. (In the example below, it is is only the e test file.)

 c.  Replace the run_test() statement with uvm_ml_run_test(). Provide uvm_ml_run_test() with the string array from the previous step and with the SV test name. (In the example below, the SV test is also the top entity in the UVM SV framework.)


For more information on UVM ML OA constructs, syntax, and other features, go to the UVM ML OA documentation in <uvm_ml_install_dir>/ml/README.html


Time to Play - You Can Now Run Your e Code on EDAplayground

$
0
0

Over the years I've often hoped to have the ability to show someone (a customer, or one of our field engineers) a bit of e code, and explain what it actually does. People say that a picture speaks more than a 1,000 words, so you could say a bit of code does have the same effect on engineers.

Well, since the beginning of this week you can do exactly that with your e code on a very neat website called http://www.edaplayground.com. The website is powered by the cloud, and lets users edit some code, and then pass the code to some tools for execution. The results (log files and VCD information) is passed back to the user. This is really cool, since you can now code up some stuff and try it out without having to have access to a tool installation – perfect for sharing, or for people who want to learn by doing (i.e. students of MOOC like this one https://www.udacity.com/course/cs348 ;-) )

We’ve put up a couple of examples and I’ve captured the essentials to get you started in this video:

(Please visit the site to view this video)

Happy sharing,
-Hannes Froehlich

Dealing with Specman-Simulator Interface Issues—Get Ready to Cook!

$
0
0

Two great documents, aiming to make life easier for a verification engineer, were published in the past year. Written by Cadence support specialists with years of experience in problem solving, these documents go over all the aspects in the Specman-Simulator Interfaces domain, present what kind of problems the engineer might get, how to identify them, and how to analyze the problems all the way to possible solutions.

The documents are written in a "cookbook" format, in that you can start from scratch and collect all the ingredients needed to identify and resolve the issue you are facing. The first cookbook deals with synchronization, while the second one touches the architectural aspect.

So grab your apron and start to cook!

Specman Simulator Interface Synchronization Debug Cookbook

Debug Cookbook For Specman Simulator Interface (Architectural) Problems

Avi Farjoun

Specman Support Team 

Updates from the UVM Multi-Language (ML) Front

$
0
0

An updated version of the UMV-ML Open Architecture library is now available on the Accellera uploads page (you need to login in order to download any of the contributions).

The main updates of version 1.4 are:

  • UVM-SV library upgrade: This release includes UVM-1.1d, enabled for work in context of UVM-ML, replacing the previous UVM-1.1c version
  • Portable UVM-SC adapter added: Enabling usage of UVM-ML with vendor-specific implementations of SystemC
  • Multi-language sequence layering methodology and examples added: Demonstrating best-known practices for instantiating a verification component in a multi-language environment and driving sequences and sequence items across the language boundary
  • Performance improvements in the backplane and the SystemC adapters
  • The examples directory structure was simplified: All the examples are now directly under the "examples" directory, grouped by topics

We also found that several users struggled to install and setup the UVM-ML library, so we recorded a short video on how to best achieve that. If you see some strange message or paths, check out this video and make sure your setup is correct.
(Please visit the site to view this video)

One more thing—the Accellera Multi-Language Verification Work Group (MLV-WG) has collected a thorough set of requirements, and has started working on defining the ML standard. The UVM-ML OA library is very well aligned with these requirements.

Happy coding,
Hannes Froehlich

Connected Field Sets – What Are Those and Why Should I Care?

$
0
0

Right form the start Specman has been very good at generating constrained random stimulus. Value generation guided by constraints is achieved with an algorithm within Specman that is at the very core of the tool. And solving constraints is one of the most outstanding features of Specman itself.

In the early days of Specman, the constraint solver (called PGen) had been continuously augmented and improved over time. However, at some point, this constraint solver reached its limitations due to the ever-increasing complexity of constraints, and a new constraint solver was created. This new constraint solver, called IntelliGen, became the default constraint solver in Specman and it has seen a lot of development to further improve generation performance and capacity. IntelliGen has not only gotten faster and smarter, it has also stayed as backwards compatible as possible. This means that you can still run old e constraints in IntelliGen without noticing that the engine under the hood for resolving constraints has changed.

Several years ago, I transitioned from PGen to IntelliGen, and even while migrating problematic constraints from PGen to IntelliGen, I had very minimal hiccups. The issues I did encounter did not relate to getting the code to compile, but rather related to how the constraint interpretation (also known as semantics) changed with IntelliGen.

It helps to understand how IntelliGen does all of its magic, because to predict how a constraint model is solved, you have to know how IntelliGen ticks:

  • IntelliGen looks at all constraints upfront
  • Then IntelliGen partitions generative fields into groups
  • Each of these groups is then solved together, as one entity

Each group of constraints has a bunch of elements. These elements are fields that are tied together by the constraints.

In this simple example, we see two constraints. Each of the constraints creates a group that connects a number of fields together.

example

The technical term for such a group of elements is “Connected Field Set” (CFS), and understanding this will help you understand IntelliGen’s warnings and errors as well as how performance is impacted by certain constraints.

Any field which is used in constraint expressions is linked to other fields in those expressions. There are some expressions which cause fields to be inputs. An input is a field that needs to be generated first, and whose value is then used as is. A method call, for example, makes a field an input, since the generator cannot understand what a method does. So the field is just passed as is to the method, and the result is used. The read_only() method also does this, although there is no method to call. So all this does is make the field which is passed an input.

For the example we get 2 CFSs:
CFS 1: a_uint, b_uint
CFS 2: c_byte, d_nibble

The field c_byte is also involved in CFS 1, but only as an input. What this means is that CFS 2 is first resolved, and then the value of c_byte is passed into CFS 1. When CFS 1 is resolved, c_byte is not changed, only its value is used.

The simplified characteristics for fields and CFSs can be summarized as follows:

  • Every generative variable (field) is only in one CFS (exclusivity)
  • All generative variables which are related via constraints are in the same CFS
  • During generation, all variables of the CFS are solved together with all their associated constraints
  • Any input to a CFS is the same for all fields of the CFS

Keep in mind that there are exceptions to these rules, but these will be discussed in future articles.

Great, now we’ve established a common terminology and explained what CFSs are! These have been at the heart of constraint generation for a while now, and if you haven’t heard of them then good for you because Specman never complained about them and your constraints are well written. Or are they? Perhaps you should take a good look in your Specman console and log-files and search for some warnings:

  • *** Warning: GEN_BI_DIRECTIONAL_LIST_PM
  • *** Warning: WARN_GEN_BIG_LIST_SIZE
  • *** Warning: WARN_GEN_BIG_LACE
  • *** Warning: WARN_GEN_SAMPLING_FAILURE_IN_SOFT
  • ...

You can retrieve all generated warnings and errors by using the following command in the Specman command line:
Specman> show notify *GEN*

These warnings may give you some very useful information on the reported constraint’s performance or on some possible unintended results.

In summary, knowing about CFSs will help you write constraints that are a lot more efficient, and will also help you understand unintended behavior as well as generation-related performance issues. 

This article is the first one in a new series to highlight constraint-modelling in Specman, to give you food for thought and help you get more efficient modeling constraints. There will be more articles coming in the following weeks/months to address specific topics which I found helpful when dealing with constraint-modeling and debugging. 

Stay tuned and thanks for reading.


Daniel Bayer


Using Generative List Pseudo Methods in Constraints – A Case Study

$
0
0

This article highlights the use of list pseudo-methods constraining the content of lists, which is relatively new and offers a lot of power in terms of modelling, performance, and debugging.

Ethernet-based communication is getting more pronounced today and will continue to do so in the future. This increases the need to be able to verify devices that are capable to handle specific bandwidth requirements. Shaping constrained random Ethernet traffic can be quite complicated, especially if a specific set of requirements needs to be properly exercised.

In this example, the requirements are:

  1. Generate a stream of Ethernet frames that fits within a given bandwidth
  2. Ethernet frame sizes have to vary between a minimumand a maximum frame size
  3. Ethernet framesizegeneration shall be independentfromotherEthernetframeparameters

The first requirement refers to bandwidth. In this context bandwidth is defined as the number of frame bytes per time window. The second requirement refers to boundaries that are applied to each frame. Each frame’s size needs to be in between a given minimum and maximum size. The third requirement indicates that the generation of the frame sizes is independent of other frame parameters and can be determined in a separate variable.

Based on these requirements, we can now think about how to model the constraints. In a first step, we need to understand the data structures involved. Since the requirements state that we want to generate several frames with varying sizes, without having to generate the whole frame upfront, the best fit for such a model is a list of unsigned integers (to represent the frame size).

Furthermore, we might need this kind of constraining several times throughout our testbench, and we might need to do this kind of constraining with different bandwidth values, minimum and maximum frame sizes. In order to achieve this, it makes sense to encapsulate this constraining process within a method returning a list of unsigned integers.

In the following code snippet you’ll see:

  • The data structures to hold the frame sizes (list1, list2, and list3)
  • The constraint block to assign the various frame sizes
  • The value-returning method containing the requirement constraints
  • A post_generate block for message output

Looking at the gen-result-keeping block, you’ll notice that the requirements are almost plain text readable in the first three constraints, which facilitates maintenance and debugging.

However, there are some gotchas you should be aware of:

a) When applying list constraints, you need to keep in mind that the list size will be generated before its items. This means that the list size generation and the list element generation is handled in two separate CFSs and there is no backtracking between these two CFSs, which is why the fourth constraint in this gen-result-keeping block is needed.

b) Due to backwards compatibility, using list pseudo-methods such as min_value() and max_value() in constraints currently yields the warning DEPR_UNIDIR_LIST_PSEUDO_METHODS_141, which in our example will lead to a GEN_NO_GENERATABLE_NOTIF error if the bidirectional solving is not enabled.

Additional new generative list pseudo-methods that also support bidirectional solving are:

  • all_different( item: exp, bool_exp: bool ): bool (conditional)
  • and_all( exp: bool ): bool
  • or_all ( exp: bool ): bool

Bidirectional solving of the above mentioned list pseudo-methods was first introduced in Specman 14.1. Enabling the new list constraints bidirectional solving can be done directly in Specman.

  • conf gen -bidir_list_pseudo_methods=ALL_SUPPORTED_SINCE_141

or using Incisive Runner (irun)

  • irun -snset "conf gen -bidir_list_pseudo_methods=ALL_SUPPORTED_SINCE_141" ...

Note that bidirectional solving will be enabled by default for Specman versions 14.2 and above.


Thank you for reading and happy constraint coding,
Daniel Bayer

How I First Heard About Sebastian Thrun and Udacity

$
0
0


Before my wife became a writer, she was a director at Massachusetts General Hospital. In this position she met a lot of interesting people. Among them was Dr. Thomas Bernard Kinane, a pediatric pulmonologist. One day, he recommended that she watch Sebastian Thrun on the Charlie Rose television show.

She was impressed enough with Sebastian and what he had to say, that she made me sit down and view the show myself.

(Please visit the site to view this video)

On the show, Sebastian talked about, and demonstrated, a technological innovation called Google Glass [see Sebastian’s interview at time 16:40]. This was the first time Google Glass was shown to a journalist. Sebastian, among many other things, is a Google Fellow, designed Google StreetView, the self-driving car, was the leader of Google X Lab, and  was a CMU and Standford professor for robotics and artificial intelligence. He is the most accomplished and revered innovator that I have had the pleasure to meet (more on that later).

Google Glass is certainly very interesting to me, as an engineer. However, what really struck a chord with me was his mentioning of Udacity, the online university providing Massive Open Online Courses, MOOCs.

In my position at Cadence Design Systems, I have been involved in developing training for engineers for many years. Before I learned about Udacity, I heard of the works of Salman Khan and his Khan Academy in an OnPoint interview. I was fascinated by his approach, and I tried to apply it to my work by creating a series of videos that help engineers ramp up on very specific and niche concepts and software features. It quickly became the most viewed video series on the Cadence YouTube channel.

During this time we were exploring other methods for training more engineers in an effective manner. As a result, the MOOC approach that Udacity was taking sounded very compelling and suitable for our needs. Shortly after I watched the Charlie Rose interview [see the Udacity segment at time 26:40] I approached Udacity and got the opportunity to meet Sebastian himself. Somehow, I was able to convince him [it still baffles me as to how I pulled that off] to let Cadence create a class with Udacity! This class became CS348 Functional Hardware Verification.

As a side note–a few months later, a Time magazine article titled College is Dead. Long Live College! about MOOCs and Udacity was published as the cover story. It was then that I found out that I was very lucky indeed to have been selected as an instructor, because Sebastian had already turned down 500 university professors who volunteered to create courses for Udacity!

To wrap this up, my adventure with MOOCs and my encounter with Sebastian would have never occurred had my wife not had the insight to force me to view the Charlie Rose program. I am very grateful for her recommendation as it allowed me to become an instructor at Udacity.

Stay udacious!

Axel Scherer

Satisfy Your Need for Verification Speed—How to Run Your UVM Cowbell on Palladium XP in Acceleration Mode

$
0
0

If you have been living in the US for the last few years (if not, I have a treat for you) and have paid any attention to TV ads, you've probably seen the AT&T Bigger is Better commercials, where an adult interviews a group of young children about which qualities are important to them.

The mantra is that bigger, faster, more is better. We all know that this is not always the case. However, in verification we know that a simulation can never be fast enough.


(Please visit the site to view this video) 


As design complexities grow, you need more and more complex tests. You need more machines and you struggle with your available resources. This struggle is dangerous because it might impact both the quality as well as the productivity of your verification efforts.

If you miss a bug because you did not run that all-important test, you are in big trouble. If you wrote the entire set of required tests, but your iteration time is too slow, you risk missing the market window.

You can have the biggest compute farm in the world, but it probably won’t save you. The critical, long-running tests are the long poles in the tent and will forever dominate your verification iteration time.

Simulation tests that run for many hours, or even days, might kill your productivity.

When you are in this situation you should take a serious look into simulation acceleration using the Cadence Palladium XP hardware accelerator. The Palladium accelerator can address not only the long pole problem, but in addition, it opens up opportunities for you to write longer and more complex tests that would be unrealistic on a simulator.

Many engineers are afraid of using hardware acceleration because it can be intimidating. However, Cadence has developed collateral that will help you to get started and productive quickly. In particular, we show you how a few tweaks to your UVM environment can accommodate both high-speed simulation, as well as acceleration, all from the same verification environment!

To help you understand UVM-based acceleration, we have published a set of introductory videos that will explain the basic concepts and walk you through an example that you can also access as a rapid adoption kit from Cadence online support. Don't miss these videos here: (Please visit the site to view this video)

Bruce Dickison, might have a need for “more cowbell!", but we all have a need for speed!


Axel Scherer


Lazy Test Cases for Tool Failures Using the Testcase Optimizer (TCO)

$
0
0

The Current State

It seems to be a fact of life that software has bugs and, unfortunately, our software is no exception. In most cases, however, it is not the bug itself that causes you grief. Rather, it is the fact that analysis, workaround, and shipping the fix to you sometimes takes a long time, and requires a lot of deep interaction between the user and Cadence R&D developers. Although in an ideal world, the process sounds simple, in reality there are a few hard problems involved here:

  1. The secrecy issue: The tools, especially in the EDA world, are working on proprietary data and designs. These IP cores are a company's keys to success in the future–it's their magic sauce. Therefore, it is almost impossible for Cadence R&D to routinely obtain source files for a customer's project in order to re-create the issue. By the same token, we do not bring our source code into the customer environment and debug there. An additional obstacle is that Cadence might not even be legally allowed to obtain access to parts of the design since it is 3rd party IP and shared with the customer, but not with Cadence.
  2. The size issue: SoC chips today have grown to be very large, and require complex flows to manage all the dependencies that have been developed by almost every customer. It is very hard to collect all the dependencies correctly and recreate the same setup/environment or flow within Cadence.
  3. The manual effort issue: Building a test case manually may take days to weeks of effort of a skilled person (either our engineers or our customer’s time) who needs to spend his or her precious time to solve issues #1 and #2.

One way to solve these issues is to make the failing environment as small as possible and remove all unnecessary design parts that are not strictly needed to recreate the issue. A tool which can automatically perform such a task gives the debug engineer a much better handle with which to deal with the tool issues and to fix them within a reasonable turnaround time. Furthermore, an automatic approach is easily accepted by customers since no engineering resources are blocked and the often seen cycle of "we need a test case –vs. we have no time to create one" deadlock is broken.

Test Case Optimizer  (TCO)

TCO is a small, generic utility that is shipped in recent IUS (11.x and up) installations, and allows you to automatically create a test case from a failing flow invocation. The term generic here means that it does not require any special tool support, design style, specific options, or that it can only deal with special kinds of failures. TCO attempts to strip down the input of the failing flow to the bare minimum, while still exposing the original tool failing issue. The important point is that TCO only preserves the failure signature and is otherwise free to remove any functionality/legacy information present in the input data. With this approach, TCO has proven very successful on stripping down simulation source files in languages such as SystemVerilog, Verilog, VHDL, C, and SystemC. A reduction of the overall source input data size by more then 99% is common. Since TCO does not preserve functionality (other than the same crash signature) most, if not all, legacy code is typically removed from the input. Since the remaining code is typically free from proprietary sections, the result of a TCO run can be shipped to Cadence without exposing IP information. Very often TCO can remove so much from the input that complex flows just end up in one or two plain tool invocations which illustrate the original failing issue! 

And, best of all for the engineer, TCO runs automatically after a short setup and will report back when finished.

A Simple TCO Example

The following example uses a single, small IUS internal error and an old (9.2) version of the simulator to illustrate the flow, but TCO is known to handle multi-megabyte test cases.

module sub#(
int MAXPORT = 4
) (
input bit clk,
input logic a,
output logic chk,
input logic [31:0] p[MAXPORT:0]
);
always @(posedge clk)
chk <= a && !$past(a);
endmodule
module test_m();
localparam MAXPORT = 8;
bit clk = 0;
always #5 clk = ~clk;
logic port;
logic chk;
logic [31:0] count1[MAXPORT:0];
sub#(MAXPORT) sub_1( .a( port ), .p( count1 ), .* );
initial begin
@(posedge clk);
port <= 1;
@(posedge clk);
@(posedge clk);
port <= 0;
@(posedge clk);
@(posedge clk);
port <= 1;
@(posedge clk);
port <= 0;
@(posedge clk);
port <= 1;
@(posedge clk);
end

sequence sts_ast (port);
logic [31:0] count1[MAXPORT:0] ;
( chk, count1[port]+=1 );
endsequence
assert property( @(posedge clk) sts_ast( port ) );
initial #100 $finish(2);
endmodule

When the example is run using a 9.2 version of IUS, the simulation ends with this message:

uwes@vl-uwe[none]~/src/tco/aet_debugging_crashes_using_tco/tco_lab/lab1$ irun test.sv -quiet
ncvlog: *F,INTERR: INTERNAL EXCEPTION
-----------------------------------------------------------------
The tool has encountered an unexpected condition and must exit.
Contact Cadence Design Systems customer support about this
problem and provide enough information to help us reproduce it,
including the logfile that contains this error message.
  TOOL: ncvlog  09.20-s055
  HOSTNAME: vl-uwe
  OPERATING SYSTEM: Linux 2.6.18-194.el5 #1 SMP Tue Mar 16 21:52:39 EDT 2010 x86_64
  MESSAGE: p1_5_xabvinstances: default VST
-----------------------------------------------------------------
csi-ncvlog - CSI: Cadence Support Investigation, sending details to ncvlog.err
csi-ncvlog - CSI: investigation complete, send ncvlog.err to Cadence Support
irun: *E,VLGERR: An error occurred during parsing.  Review the log file for errors with the code *E and fix those identified problems to proceed.  Exiting with code (status 255).

At this point there are usually not many options left to try, so let's see how TCO helps us here.

The following steps outline the TCO setup used to reduce the example.

Script the Failing Tool Invocation and Failure Analysis

Essentially all we need to do here is put the failing command into a script file, which invokes the failing flow. After the flow has finished, it reports back to TCO whether the failure has been seen or not. Here we simply start the flow with the irun command and once finished, we check the logfile for the failure signature.

#!/bin/bash
#
# this script should evaluate the configuration and should return [0,2]
#
#
#set -x
FAILURE_PRESENT=0
FAILURE_NOT_PRESENT=2
irun -quiet test.sv -clean > /dev/null
grep p1_5_xabvinstances irun.log > /dev/null
if [ $? = 0 ]; then
exit ${FAILURE_PRESENT}
else
exit ${FAILURE_NOT_PRESENT}
fi

Now, the invocation can be tested and if the failure is present, the return status of the script should be 0.

Run TCO

To simplify TCO startup, a startup script of just a few lines is typically used. Essentially TCO needs the following two things in order to run:

  1. The set of files to work on. These are typically the full or a subset of the input files for the failing flow. 
  2. In the invocation script we build in the first step which allows TCO to run the test case automatically
#!/bin/sh
tco=`ncroot`/tools/tco/bin/tco.sh
#
# collect list of files we want to work on
#
find . -name \*.sv -o -name \*.svh -o -name \*.v -o -name \*.psl > list

# TCO wants to write the files so make them writable
chmod +w `cat list`
${tco} -codebase . --fileset list --testscript ./run_test.sh --inplace --timeout 25

TCO briefly runs for a couple of seconds invoked using the script. The final status for the example is a reduction of 75%. 

2014-08-20 14:16:52,781 INFO - new/original size ~206/800
2014-08-20 14:16:52,784 INFO - reduction is 74.3%
2014-08-20 14:16:52,796 INFO - result is in .
2014-08-20 14:16:52,796 INFO - took 27.000 seconds to perform
2014-08-20 14:16:52,797 INFO - final status FAILURE_NOT_PRESENT:62 FAILURE_PRESENT:13 CONFIG_REJECTED:24 reduction: 74.50% removed=596bytes currentsize=204bytes
2014-08-20 14:16:52,797 INFO - finished
2014-08-20 14:16:58,458 INFO - TCO run completed.

Compare the Results

Once TCO has finished, the reduced results can be analyzed. Keep in mind that TCO will never create or delete files, nor will TCO rename any literals nor inject any new code (it will only remove code).That allows you to relate the code back to the original sources. Now if you ask what problem in this code is causing the tool failure, then it's simply the code line which is not required by another code line(s). In this example, it's the marked line. Since we now know which line causes the issue, we can now easily:

  1. Attempt to find a workaround by rewriting the offending construct/statement
  2. Disable the offending fragment till we get a fix (and also emit a message that this needs to be closed)
  3. We have a small test case we can ship and which has most other/legacy/secret code removed
  4. Since small dependencies are removed from the test case, we can reproduce the error outside of big flows
module test_m();
localparam MAXPORT = 8;sequence sts_ast (port);
logic [31:0] count1[MAXPORT:0] ;
( chk, count1[port]+=1 );  // <<<<<<<<<<<<<<< no other line depends upon this one, therefore this is triggering the tool issue
endsequence
assert property( @(posedge clk) sts_ast( port ) );endmodule

Summary

TCO is a great utility which lets you create test cases for tool failures. As a customer you can create test cases without big manual effort and time investment/engineering, The result is typically acceptable even for secrecy-concerned customers, or it can be made acceptable with minimal effort. For a vendor, the TCO approach provides test cases which can be run and debugged locally without any overhead, resulting in much faster workarounds and/or fixes. In summary, TCO is a tool you should be aware of because it provides value when you need it most. Cool, isn't it?

References

Cadence online help: search TCO

U.Simm: "Rapid creation of reduced tool failure scenarios," CTC 2013

Uwe Simm

It’s a Kind of Magic: How Calculated Messages Can Make You a Hero, and There Can Be More than One!

$
0
0

At the risk of dating myself—oops, it is too late, I already did so last August while talking about display density innovation—I will use a metaphor from a nineteen eighties movie to illustrate the power of calculated messages.

Sometimes you come across a feature, or a product, that deserves the term magical. The late Steve Jobs used it when introducing the iPad in January 2010. [Sorry I only found an iTunes link for the official footage.] Some people think his comment was over the top, but I think he truly believed it. When I used an iPad in an Apple Store for the first time, I could sense what he meant. At that moment, he got me, and I am truly a fan, if you have not realized it by now. For modern innovations like high precision, useful touch interfaces on smartphones, magic really did happen; at least at the time when those products hit the market. By now we are all used to it, and we have stopped appreciating the magic of devices using iOS and Android, although they only hit the market in 2007 and 2008 respectively—a mere seven and eight years ago!

In 1986, the movie Highlander was a big hit (at least in Europe), in particular with adolescent males. Although it is somewhat of a fantasy movie, which I typically cannot stand, I must admit I liked this one at the time. I’m not sure what I would think if I saw it today for the first time. I will find out once my kids watch it with me some day—and if I am not too forgetful, I’ll report back on this channel.

The gist of the movie is that there are these magical guys, stemming from the Scottish Highlands who are immortal. This immortality however, is a curse rather than a blessing. As we follow the main characters through the centuries, we discover that, for some odd reason, all Highlanders need to kill each other. Their motto is: There can be only one! So, our hero kills the other Highlanders, with a sword nonetheless, and even in the 20th century, if I recall correctly. Some of his opponents are also acting this way. The group is reduced over time until there are only two Highlanders left. The last one standing will become a mere mortal and shed himself of the curse of immortality.

As we have the advantage of being mortal already, we do not have to go through all this bloodshed. However, it would be great to have a little bit of pure magic at our disposal. And I am happy to say that Cadence can give you some. As I mentioned in my last post about IoT and Incisive Debug Analyzer, we have a very potent and innovative debug product in the Incisive Debug Analyzer (IDA) that can dramatically increase your debug productivity. And, it has some magic in it, too!

One aspect of this IDA magic is a feature called: Calculated Messages, which is another way to help you reduce debug iterations. During a complex debug cycle, you are in a quest looking for answers, looking for the cause of a problem. In the Highlander movie, the quest was to become mortal. In debugging, the quest is bug root cause analysis.

A typical debug database or simulation run produces tons of data. It is your job to navigate this ocean of data and extract meaningful bits to help you find the cause of a problem. Often, this involves the annotation of additional log messages. Classically, it requires a change to your code, testbench, or DUT and then yet another simulation run, and a stop at the watercooler, or an extended coffee break in cases where you have a complex and long-running test. The classic approach is extremely expensive because of the extra run time, wait time, associated frustration, and loss of productivity due to temporal discontinuity of the debug process.

IDA’s calculated message feature addresses this problem head on. A typical verification environment already includes a lot of message generation capability. You can control the message verbosity, the debug scope, and so on. However, up until recently, you were stuck with what you had. Now, with the magical message generation feature of IDA, you can add incremental messages on the fly.

(Please visit the site to view this video)

In other words, you can calculate new messages, whose values for variables and such, can be derived from your debug database. This is pretty awesome and you need to try it as soon as possible! Many users have found this to be a killer feature of the Incisive Debug Analyzer. To get a better sense of the magic at work, see the video below. 

Our motto is not: There can be only one! Instead it is: We can be heroes (too and for more than one day)!

Axel Scherer

Searching Through a Complex Design? DFS to the Rescue!

$
0
0

Recently, while at a customer site, I was faced with the huge task of looking for all instances of a specific module to find a particular signal assignment. My first thought was to do a grep search, and then go through each file to see where that particular assignment occurred. This seemed easy enough in theory, so I set out to do it. What I was not prepared for was:

  1. Not knowing where the source files were actually located in the customer’s file system
  2. Not knowing whether or not all the relevant files would be visible and accessible, or even if some extra/backup files would be shown

 To work around the first issue, I looked through the log files and tried to search for all the directories listed in the files. I quickly realized that I would not make any progress this way, and instead decided to use grep at the top-most directory. Imagine my shock when I saw hundreds of entries for this module! It seemed that the user had created a few copies of the files for backup, and now I had the tedious task of filtering through them all.

Design File Search

Fortunately, the Incisive verification platform has a feature called Design File Search, which is included in the SimVision analysis environment, that makes this job much easier.

Using Design File Search, you can limit your search to the files that make up the design, so you don’t have to worry about extra copies lying around. Also, you don’t need to know the directories of these files beforehand. This also lets you open the file in the SimVision Source Browser, thus enabling you to set breakpoints as well.

 To search for a string in all of the source files that make up a design, including any simulator TCL scripts specified at startup with the -input option, do the following:

  1. From any SimVision window, choose Windows - Tools - Design File Search, or right-click and choose Send to Design File Search. When you do this, SimVision opens the Design File Search form.
  2. Enter a grep-style search string in the Regular expression search field of the form
  3. Enable Case sensitive, if you want the search to match the case of the text string
  4. In the Match files with pattern field, enter a glob-style pattern representing a file name, or partial name, to limit the search to a specific file, or set of files. You can specify more than one pattern, separated by spaces, and SimVision matches both patterns. For example, if you specify *.sv *.v *.vhd, SimVision returns all files with the .sv, .v or .vhd file extension.
  5. Click Search, and SimVision returns the file name, line number, and text that matches the search string
  6. Click a row in the results list to display the file in a Source Browser window, with a blue pointer positioned at the line number

 The following figures show the difference in the results for a small example when I used grep to search for the string ahb_monitor and when I used the SimVision Design File Search function.

Figure 1 shows the output of the search using grep. It shows all text matches, be it in backup folders or logs.

 Figure 1: Output of the Search Using grep .

 Figure 2 shows the output of the search using Design File Search. It shows only the files that make up the design.

Figure 2: Output of the Search Using Design File Search.

 Clicking on any occurrence of the search string opens the relevant file in the Source Browser, as shown in Figure 3. Note the blue pointer positioned at the line number, in Figure 3.

  Figure 3: The Relevant File Opened in the Source Browser

Limitations

As far as limitations go, when you open a source file in this way, the file has no context within the design. Therefore, you cannot view the values of objects or expand macros in the source file.

Summary

I once had a customer searching through a lot of files for a particular string. His intention was to do a grep search followed by a series of filters to remove all log files, unwanted directories, and so on. Our interaction went something like this:

Me: Hey, why don’t you try the Design File Search in SimVision?

Customer: What’s that?

Me: Let me show it to you.

(I proceeded to show him how it made searching much easier and productive).

Customer: Hey, that’s fantastic! How come we never knew of this?

Since then, I’ve seen not just this customer, but many more people use SimVsion Design File Search to make searching through complex designs an easy task.

This feature is not commonly known (for reasons I can’t fathom) but has definitely proven useful, not only to me but to all the customers I’ve shown it to and is definitely one of the hidden gems of the Incisive platform.

More information on the SimVision Source Browser and its tools and capabilities, can be found in the document named SimVision: Using the Source Browser, which is accessible in the Cadence Help Online Library (cdnshelp) and on Cadence Online Support (COS).

Swati Ramachandran

Dealing with the "Throw it Over the Wall" Methodology in Power Supply Network Debug

$
0
0

"Throw it over the wall" is business slang for completing your part of a project and then passing it off to the next group. This phrase is usually said when there is little communication between two groups.—answers.com

I have noticed that a common scenario is for the engineers who developed the Universal Power Format (UPF) files for a device to throw it over the wall to the verification engineers assigned to run power-aware simulations. The verification engineers start power-aware simulations with specifications, block diagrams, and a stack of UPF files. When power-aware simulations first start, many of the problems uncovered are related to the Power Supply Network (PSN).

The PSN refers to the items necessary to manage and control a device’s power. The PSN consists of:

  • Power domains
  • Supply ports
  • Supply nets
  • Power switches

The PSN is the heart of the UPF and has to be defined before power-aware simulations can be run. For verification engineers who are new to low-power design, working with and debugging the PSN can be a real culture shock. This is because they are not used to working with power domains, supply ports/nets, power switches, and their interconnections.

By working closely with our users in the debugging of large SoC designs, we have found that is it very helpful to have a graphical representation of the PSN for reference. This experience led us to develop a PSN browser that provides a graphical representation of the PSN with power-aware models and their power connections. The PSN browser has been used to debug complex PSN and quickly find problems like shorted power nets, missing power connections at block-level UPF, and power-aware models. A screen shot of the PSN browser is shown below:

In the PSN screen shot, you can see all the supply ports, supply nets, power domains, power switches, and the supply net value (FULL_ON, UNDETERMINED ...). When power-aware simulation is first run, many of the problems are easy to see in the PSN. Having a graphical representation and access to the structures is very important for debug.

Here's an example: We were asked to help debug a power problem in a SoC design. In one of the power domains, the main power supply net was undetermined, and the shutoff signal was driven to a known value. Several engineers had looked at this problem, and no one could figure out why this was happening. The UPF was hierarchical with five power domains at the top level and two in the block level. The top-level UPF file had around 2600 lines of the code, and the block-level UPF had an additional 650 lines of code. The PSN of this design was viewed in the PSN browser and we quickly found that the output supply port of a power switch was shorted to the input supply port. The UPF contained supply sets and the problem was not found in the text editor, but was very easy to find in the PSN browser.

The Power Supply Network browser is available in IES version 13.2 and later. More information can be found in the Introduction to Low-Power Simulation RAK, IEEE-1801 version. This can be found on the Cadence Online Support site at http://support.cadence.com.

As someone who often gets problematic UPF files thrown over the wall to me, I always use the PSN browser in debugging problems in those files.

William Winkeler

Small is Beautiful—How UVM Test Case Extraction Can Improve Your Constraint Analysis Productivity

$
0
0

In the world formerly known as microelectronics, which is now actually nanoelectronics, small is sure beautiful. With the continued reduction in transistor size, we can afford to pack an insane amount of functionality into chips such as SoCs, while die sizes still remain tiny.

The amount of functionality on a modern SoC is truly mind-boggling. Even when you deal with a subsystem, you drown in complexity and excess information.

This can be particularly problematic in verification. Assume you are trying to stimulate your subsystem or complex block. You are very likely to use constrained random simulation with UVM. The problem is that the DUT complexity will make your constraints complex as well. This means that you need to produce a complex set of traffic into and out of the DUT.

In some cases, you might not be able to solve all the required constraints in your head. This will make it hard to predict the expected outcome, and what you should do about it. 

This problem becomes compounded when you run a serious and long simulation. 

(Please visit the site to view this video)

For example, after spending a few minutes before a randomization call, results might occur that do not meet your expectations. So you look at the results, tweak the constraints, and try again. This iterative effort can be very time consuming and annoying.

Ideally, you want to focus only on a small subset of the UVM environment. You want to analyze and iterate with the set of constraints associated just with a particular randomization call, not with the whole environment. 

In the Incisive 13.2 release, we have released a test case extraction feature that will help you solve this dilemma, and allow you to increase your constraint analysis productivity. This feature extracts just the relevant constraint set in a highly reduced test case, and it runs very fast.

Using the extracted test case, you can quickly run a large number of random seeds and analyze the randomization distribution that is achieved. You can debug constraint conflicts much faster this way, and get on with the verification.

A quick demo is shown in the video embedded above.

Once you have finished debugging the failure, and have obtained the expected result with the highly reduced test case, you can integrate your constraint changes back into the larger environment and get on with your main task of completing the verification of the DUT.

This is a true hidden gem and can make your day.


Keep on randomizing!


Axel Scherer

Incisive Product Expert Team
Twitter, @axelscherer 


Viewing all 670 articles
Browse latest View live


<script src="https://jsc.adskeeper.com/r/s/rssing.com.1596347.js" async> </script>