Quantcast
Channel: Cadence Functional Verification
Viewing all 666 articles
Browse latest View live

Pablo Picasso and the Power of Abstraction: Make Sense of Your Verification Traffic Using the UVM Sequence Viewer

$
0
0

Abstraction is a key concept that makes it easier for humans to deal with large and complex systems. Since abstraction reduces complexity, without abstraction, hardly any innovation would be possible because the human brain cannot process large sets of low-level items and make sense of them. 

Abstraction not only plays a significant role in engineering and science, but also in art. Artists started to abstract to show the essence of their subject. For example, Pablo Picasso used abstraction when he drew the essence of a bull, and many other artists followed with similar drawings.

In a similar way, today’s engineers make use of abstraction to simplify the essence of their complex designs. 

(Please visit the site to view this video)

The Universal Verification Methodology (UVM) has clearly become the predominant verification methodology and library. UVM provides a set of classes and an approach that is designed to make verification more productive, streamlined, and consistent. 

In order to make the use and the adoption of UVM easier, Cadence has added several GUI features that can help you in your interaction and debugging of your verification environment, and its associated tests.

One of the gems of our extensions to UVM is the UVM Sequence Viewer. The Sequence Viewer provides you with the ability to abstract an essential and complex part of an advanced environment and test suite: the verification traffic (in the form of UVM sequences). In use, the UVM Sequence Viewer shows you all the sequences and sequence items that are in the simulation. You can see sequence hierarchies on a per-sequencer basis, including fields, and their values. You can also view them on a type-basis.

The reduction in complexity enabled by the Sequence Viewer allows you to quickly get to the essence of the traffic of the test. And, it implicitly allows you to quickly assess if this traffic meets your expectation.

Let’s abstract to get productive!

Axel Scherer
Twitter: @axelscherer


Before There Was a Transaction, There Were Signals

$
0
0

Transaction-based verification has been around for many years. A transaction is an abstraction that consists of a single transfer of data and control signals. With today’s complex SoCs, we need to abstract in order to build complex verification environment and test scenarios. Indeed, we want to build hierarchies of transactions: From simple packets, to complex higher-level layers of traffic.

In UVM, the lowest level transaction is defined as a sequence item. Sequence items are combined into a sequence, and sequences can be combined to create more complex sequences. So far, so good.

(Please visit the site to view this video)

The problem is that this hierarchical build-up can get fairly complex quickly. As these sequences and sequence items are typically randomized, you can end up with very funky traffic patterns. When you assess or debug your traffic and the associated constraints, it might be very hard to make sense of what actually happened.

However, with Cadence verification tools, we have had the ability to record these transactions in the waveform database and view them in the waveform browser since the 1990s. The concept of transaction recording and viewing is virtually crying-out to be applied to UVM because UVM operates primarily at the transaction level. You can see how this works in the video embedded above.

Stay abstract, stay sequential!

Axel Scherer
Twitter: @axelscherer

Blast From the Past—Or Debugging HDL Race Conditions And Glitches

$
0
0

In 1999, the movie Blast from the Pastwas released. It begins in Los Angeles in the 1960s, during the Cold War era. In this movie, a nerdy, engineering-type father was afraid of a potential conflict involving nuclear arms. He built a personal, massive fall out shelter/apartment underneath his home. No less than the great Christopher Walken of cowbell fame played the father! 

To make a long story short, an airplane crashed in the neighborhood and the father thought this meant that a nuclear bomb had been dropped. He took his pregnant wife with him downstairs and activated a timer that locked the shelter door for 30 years.

During that time, his wife gave birth to a son, played by Brendan Fraser of The Mummy fame, who was deliberately named Adam. After 30 years Adam leaves the shelter and explores Los Angeles, which by then is in the 1990s, and it is both very scary and very exciting for him. After a while, he meets a girl, called Eve, of course, and played by Alicia Silverstone of Clueless fame. 

When Adam and Eve meet, Eve experiences a massive blast from the past because Adam exposes her to the culture and worldview of the 1960s.

In today's engineering world, we face many blasts from the past as well. For example the original hardware description languages (HDLs) were developed in the 1980s. They allow for multiple events to occur in a single time slice.

The consequence of this freedom was that EDA vendors, in particular simulation vendors, could make a judgment call in implementing features of the language where specific behavior was simply not stringently defined.

Expect the unexpected

This can lead to situations where identical HDL code leads to different results between different simulators. The use of proper coding style and using proper constructs can avoid the bulk, if not the entire problem. But we all know that this is more of an idealistic view of the world, rather than a practical view, when it comes to computer languages.

One of the biggest complications is the occurrence of race conditions and zero time glitches. In practice, you might logically expect a certain value for a signal, but you might get something totally unexpected. 

Even when you analyze the signal’s value transition in a waveform display tool, you might find yourself in a totally alien world. However, if you are a Cadence customer, you are in luck, because we have tools for interpreting that world.

When you probe a signal during a simulation, by default you only get an abstracted view of the world—you see the outcome of the logic evaluation of the simulator. This is done because it makes the waveform database much smaller, and accesses to it much faster, but it records viewer details.

This is OK in most cases because hopefully, you have very few race conditions. 

However, with the Incisive simulator we can probe with higher level of granularity and also record the low-level events that occur before the final value of a signal is determined. In this case we use the event switch when creating the waveform database.

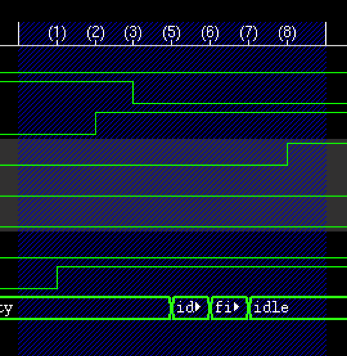
Once you record your signal transitions in this way, you get the lowest level details, which you can then use to determine where the races or glitches originate. Figure 1 shows that multiple events occurred between the values of fifty and idle using the yellow one-shot symbol.

Figure 1

Clearer picture

You can then expand the so-called sequence time and you may see that a signal in between a clock rise or fall event will not just go from 0 to 1, or vice-versa, or even stay the same value! Figure 2 shows the events of the transition. In it you can see exactly what happens in between the signal value change.


Figure 2


More importantly, you can see how the driving signals that affect the signal of interest move through different values before they settle.

Be aware, that although this looks like a delay in the waveform display, it actually is not. Here, we are referring to RTL-level simulation, and what you see are the transitions during signal evaluation that are determined by the simulator.

Debugging race conditions and glitches can be rather tricky. However, with the help of the event recording granularity built into the Incisive simulator, you can actually see what is going on and determine the root cause. Most often you will then recode your logic to eliminate the race so that your simulation will actually do what you expect. And remember the simulation does not violate the LRM.

For more information see the product manual Viewing Events in Sequence Time and the associated video that walks your through the process. 

Keep your code clean and get rid of those race conditions and glitches!


Axel Scherer
Twitter: @axelscherer


.

Heading Off the Butterfly Effect—The SimVision "Quick Diff"

$
0
0

Functional Verification Debug Blog - SimVision Gems

 Most engineers are familiar with the “Butterfly effect” – the notion that a small change can result in enormous repercussions in the future. A similar notion applies in verification. We might expect waveform traces to match between, say, an RTL simulation and post-synthesis gate-level design for a certain signal, but we want to be sure. We want to ensure no small changes or differences in expected results result in eventual total failure of our design.

The Incisive simulation platform includes the "simcompare" tool for checking differences between waveform databases. However, if you are already working in the SimVision Waveform window, rather than running an external tool, you might like to perform a "Quick Diff" operation to check for differences between two or more waveforms that are currently being viewed.

Fortunately, this is exceedingly easy to do in SimVision.

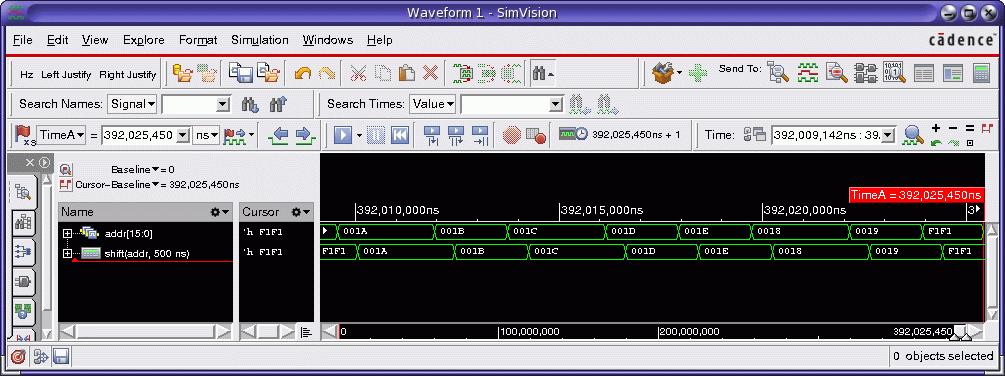
The screenshot below shows two signals in the SimVision Waveform window that you might like to check for differences. (For illustration purposes, the second signal is simply a time-shifted version of the first.)

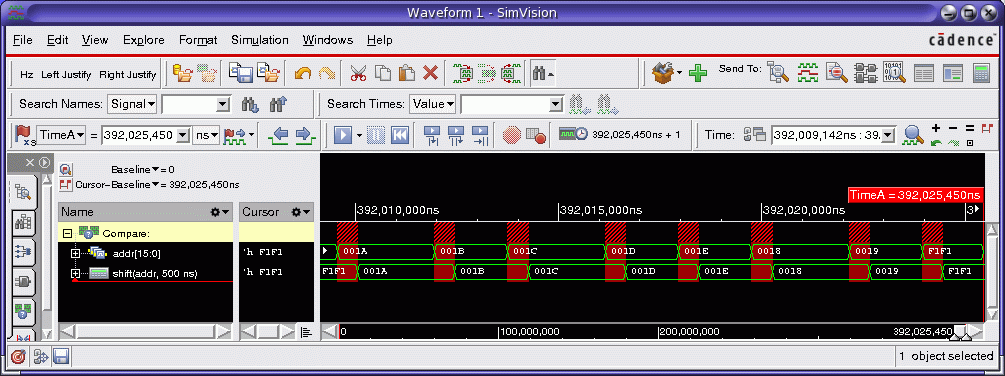
You can select two of those signals, and then right-click to display a popup menu. When you invoke the "Create->Quick Diff" operation, a third waveform trace is added to the Waveform window representing the differences between the two selected signals. On this signal the regions of difference between the original signals are highlighted with a red hash mark.

This is shown in the screenshot below:

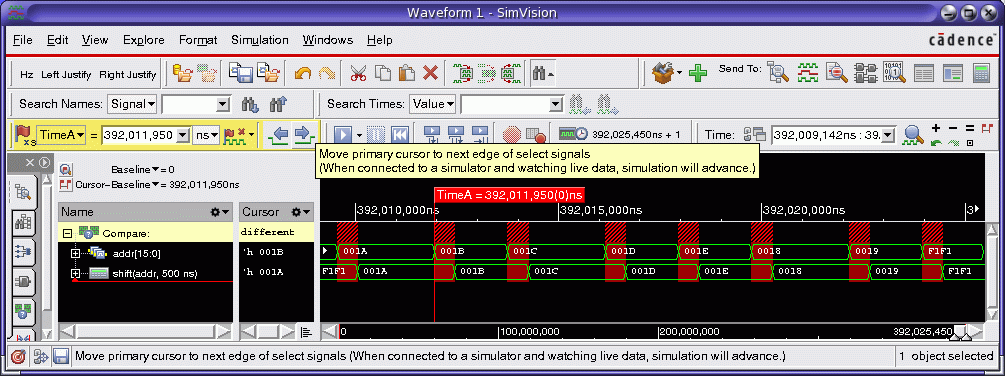
You can select the "Compare" trace and perform operations on it like any other signal. For example, you can use the "advance to next edge" toolbar button to advance the time cursor to the next change in the comparison trace. This will allow you to traverse to each difference between the original signals, as shown below:

If you need more control over the differences calculation (e.g. setting threshold values for when differences are detected), you can invoke the SimCompare Manager via the "Windows->Tools->SimCompare Manager" menu.  However, in many cases the "Quick Diff" operation is sufficient and is easily accessible within the Waveform window itself.

More details on the “Quick Diff” operation are available on the Cadence Online Support website here.

So, as we have seen, we can avoid the butterfly effect and check for waveform differences quickly and easily in SimVision.

Happy Debugging!

Doug Koslow

The Apple Car: Not a Question of Ability, But a Question of Intent

$
0
0

Rumors have been flying for years about whether Apple will create a car. Recently, this has gained more traction due to some key hires by Apple, and by boastful comments by an Apple employee, which is rather rare and unusual.

It is easy to dismiss the idea of an actual Apple car because the context is multi-faceted. My opinion is that if Apple wants to build a car, they certainly can. It will not be a question of ability at all. The reason is that the car business has changed dramatically in recent decades to lower the barriers to entry.

Car development has long ceased to be dominated by metal and mechanical aspects. It became an electronics and software problem years ago. A car has become an electronic device on wheels. Don’t believe me? Here is what Berthold Hellenthal of Audi’s electronic development department stated in May 2014 at the CDNLive users conference in Munich, Germany:

  • 90% of innovation in vehicles today is based on electronics
  • Every vehicle delivered to our customers contains about 6000 to 8000 semiconductors

(Please visit the site to view this video)

The amount of electronics and software in cars is increasing steadily. Now ask which company has mastered hardware and software development and integration? It is Apple. Moreover, they have the competence to take over the key portion of a tier 1 component supplier themselves in order to control their destiny more tightly, just as they have done with SoC development for the iPhone and the iPad. They use this as a key differentiator.

The second important aspect of the Apple car question is the transformation from internal combustion engines, to hybrids and eventually to all-electric cars.

Internal combustion engines have been refined and have become much more reliable in the last few decades. However, they are highly complex, contain lots of components, and are one of the most challenging areas of the automobile. You need fuel injection, a gas tank and pump, cooling, oil, exhaust system, catalytic converter, and on and on. It is an amazing sub-system of the car. Electric engines, however, are much less complicated. Consequently, this makes entry into the electric automobile manufacturing market much simpler.

Additionally, we have witnessed what Tesla Motors has accomplished since 2003. A Silicon Valley company where the CEO is a software guy who has done the un-doable – create a new electric car company from scratch with an attractive product. Tesla Motors has shown that this is not a pipe dream, and that the complexities of automobile development are not insurmountable.

Apple has also mastered supply chain management like few other companies in the electronics space have.

The last factor is product distribution. When Apple started to open its own retail stores for direct sales and distribution, and in of all places expensive mall spaces, everyone thought they had lost their corporate minds. The prevailing trend was just the opposite – everything moves online. And the few computer dealers with stores like CompUSA, Gateway, and others vanished quickly. But Apple’s approach has not only been successful, they are now the most profitable retailer per square foot of sales floor space in the world, and by a wide margin.

Direct sales also increases profitability and provides the ability to better control the sales process. You are not relying on the often not very informed sales staff of a traditional car dealer. You can directly and intimately show the customer where your product really shines. I have often been disappointed with how under-informed car sales personnel can be. In almost every car dealership showroom, even at high-end car dealers, the staff has no idea, or interest, in what they are actually selling. They lack both product passion and knowledge. Often, I had to inform the sales staff about the features of the cars they were selling.

So here is my conclusion: Apple has engineering power, they have more cash than necessary, we have the current trend towards electric cars, and they have supply chain mastery and direct distribution processes.

The stars are surely aligned. The question is now, does Apple want it? Is this a market they want to take on? Is this market ready for a disruption that can be sufficiently profitable for their standard business model.

By the time Apple could launch a car, we will be just before the cusp of the transition to autonomous vehicles. This means we will be in a period where the markets are changing radically. Autonomous vehicles will be a disruption by themselves. Hence, it could be a compelling point to enter the market. 

The margins in the car industry are much lower than the ones Apple is used to. However, the same thing is true in computing and mobile. Apple has been able to create margins that others only dream of.

History tells us that Apple can defy common wisdom. Still, taking on car development and distribution still would be a huge leap, even for Apple.

Fan boys would love it and so would I. Not just to have the ability to drive an Apple car, but even more importantly to see how this changes the automobile market overall, how it makes it more competitive, and therefore improves products.

The continued increasing complexity of automobile development in the electronics area, with the ever-increasing demands on software and systems, is a significant challenge for both auto manufacturers, as well as their suppliers. The EDA industry in general, and Cadence in particular, play a key role in enabling the next generation of automotive innovations. I can’t wait to see the car of the future, be it by Apple, Google, or the established car manufacturers.

Keep driving and dreaming

Axel Scherer
Twitter: @axelscherer 

Blast from the Past, Take 2: Why Are We Still Designing with Verilog 2000 – A DVCon Preview

$
0
0

SystemVerilog was ratified and released by the IEEE 10 years ago, in 2005. Since then, it has been rapidly adopted for verification. The reasons are simple – it is much more powerful than classic Verilog, and the language only has to be handled by a few classes of EDA tools, such as the Incisive Enterprise Simulator, for example.

However, in the electronic design space we see a much slower rate of adoption than in verification, and for good reasons. When you model your device under test (DUT) using SystemVerilog design constructs, such as interfaces and enumerated types, to name a few, you need to make sure your entire tool chain supports them, which can include: linting, simulation, equivalence checking, property checking, synthesis, emulation, acceleration, and potentially other applications. In other words, when you model using SystemVerilog, the bar is much higher, and so is the risk for adoption.

However, there are a few brave designers out there who have found ways to achieve the advantages of the new language features, while managing the risks. Those engineers are leading the way for broader-scale adoption within the industry. They have seen, and displayed, the possibilities of SystemVerilog, and they will share their experiences on Monday, March 2 at 9:00am PST in San Jose, CA at the DV Con 2015 Accellera tutorial, in a presentation titled: SystemVerilog Design: User Experience Defines Multi-Tool, Multi-Vendor Language Working Set.

At the presentation, you will hear from Junette Tan of PMC-Sierra, as well as from Mike Schaffstein of Qualcomm. In addition, you will get insight from industry veteran Stu Sutherland about how to use SystemVerilog assertions as part of the design methodology.

This is going to be very interesting and exciting. It is the real deal. The experiences related by these experts stem from the implementation of actual projects that went on to produce working silicon. 

Yours truly will be the MC, and I cannot wait to see you at the presentation in sunny California.

Axel Scherer

Twitter: @axelscherer 


Deque to the Rescue—Introducing the e Template Library

$
0
0

A customer working on a VIP component identified that the performance of one of their protocol checkers, written in ‘e’, is significantly worse than the performance of the competing solutions. Profiler reports of a representative test case pointed to a few complex methods, which consumed about 90% of the time. What stood out in these methods was the use of the pop0() pseudo-method on a couple of list buffers. This was a strong evidence that these lists are used as FIFO queues. SN support together with R&D suggested to try replacing these list buffers with a deque from the newe Template Library (eTL)—a FIFO data structure from the new open source package.
Here are the steps that were required:

  1. Download eTL, copy only deque code under different name and package to avoid any possible name clashes
  2. Change definition from list of bit to deque of bit
  3. Take care that the deque is initialized with “new”
  4. Grep and replace index access with set/get method
  5. Iteratively try to load code to identify and fix incompatible pieces of code, and all the fixes were trivial
  6. Run a testcase to find if behavior is okay, which revealed a couple of non-obvious compatibility problems—with a trivial fix immediately as they were identified

The whole process took about four hours, where most of the time was spent on debugging non-obvious problems, because the engineer who did that was not familiar with the code. The immediate result was that the performance of the test case was improved by 2X. Identifying and replacing additional FIFO lists improved performance even more, including other flows of the VIP component.

Most of the obviously incompatible pieces of code were operations on whole lists, such as <fifo>.add(<list>) or <list>.add(<fifo>). There were two non-obvious cases of incompatibility:
  • Unlike the size() pseudo-method of list, which returns int, size() method of eTL deque returns uint
  • In the fifo.add(pack(…)) expression, when fifo is a list of bit, the add() pseudo-method can accept bit as well as list of bit, and pack expression, whose return type depends on the context of the expression, returns list of bit. However, add() of deque of bit expects bit, so only one bit is added, and this produces different results

e Template Library

The eTL is a collection of generic data structures and related operations, intended to overcome limitations of native e lists. Right now, it includes several containers: vector, deque, linked list, keyed set, keyed multi set, and interators for them. There are plans to add more data structures and improve usability. The library is 100% open source and 100% legal e code. You are free not only to use it as is, or as a base type for your own using ‘extend’, but also to change it so that it fits your needs better, or create your own data structures using ideas and code sniplets from eTL. Code and documentation of eTL can be downloaded from http://github.com/etl-spmn/etl.

As the name suggests, the eTL uses e templates, so the data structures can be parameterized with most e types like numeric, enum, structs, and strings (however there are some limitations on special types like lists, sets, etc.).
All the documentation is embedded in comments, and there is an edoc that collects them.

The eTL containers are non-generatable structs that encapsulate different data structure behavior using a unified API, which was intentionally made very similar to the API of e lists: many methods of eTL containers have the same or similar name and signature and abstract behavior as list pseudo-methods. This allows you to experiment replacing lists in existing code with minor effort. The performance of the API methods may differ for different containers, and that is exactly why we need them. However, to benefit from their special properties, you might need to make changes that are more significant.

  • The simplest eTL container is a vector, which is effectively a wrapper for regular list. Still it can be useful when you need hooks or checks to specific operations (add/pop/remove/access), or when you can save memory by having NULL vector instead of empty list, etc.
  • Probably the most useful container is deque: it implements circular buffer using a regular list. It is intended for FIFO buffers and has significantly better performance of add0/pop0 operations, especially when it contains large number of items. The performance of these operations is always O(1) while for regular list it’s O(n). The price you pay for this improvement is a little overhead of all other operations. 
  • linked_list is also good for FIFO buffers, and in addition it also has O(1) insert and delete operations at an arbitrary index. However to use it, an iterator is required. In addition, access by index is O(n), so special caution is needed.
  • keyed_set, similarly to vector, is mostly a wrapper for “list (key:it)”, but it also enforces uniqueness of items, preventing undefined behavior. 
  • keyed_multi_set allows deterministic behavior when there are several equal items: the last inserted is the first found, and if it is removed, the one inserted just before it will be found. It also allows access to multiple items related to the same key, if exist.

Each of the containers has its own iterator, however all iterators have exactly the same API, so the code that uses iterators can handle any container. The linked_list iterator is required to take advantage of its fast operations—when the iterator is in a position inside the linked list, it can add or remove neighboring nodes in constant time.

In coming updates, we plan to add maps, more methods and macros for containers, and are open for any other ideas as well.

Rodion Melnikov
e Language team, Specman R&D 

There Will Be Blood – Ahem, Rather, Electrons If Apple Decides to Build a Car

$
0
0

Every modern device, even the ones with modest complexity, could never be developed by a single person at the quality, cost, and performance levels we enjoy today. This has been true for over 100 years – since the Industrial revolution.

Modern product development is highly dependent on knowledge, research, and engineering skills developed in the past. Furthermore, not a single company is able to go it alone anymore. The complexities and the layers in modern devices are truly mind-boggling and involve disciplines like physics, chemistry, engineering, design, and even management.

For a modern company to be successful, the key question is what to develop in-house, what to buy, or when to look for a partner.

These decisions are highly complex and are a fundamental part of making a company successful. Further on, these decisions have to be reexamined all the time as markets are continuously evolving.

Companies that successfully master these decisions can survive in the long run. Others will vanish. Companies have to determine where their sweet spot is for adding value, and cannot rest forever on that spot because the future will catch up with them very quickly.

A prime example of a company with many interdependencies is Dell. At the beginning of the PC revolution, we had Intel and others developing and selling the core hardware components like CPUs and supporting chips. We had Microsoft creating the dominant operating system: MS-DOS and later Windows, and Office, the most popular and successful application software package. Neither Intel nor Microsoft sold PCs. They focused on their respective core competencies, and still do this today.

Dell saw an opening in building PCs from the core technologies delivered by Intel, Microsoft, and others, and thus became a master of supply chain management and distribution. At their peak Dell had an astounding market share and was very clever and profitable for years.

But then the PC market changed, and profit margins shrank significantly. Profitable growth in the PC market became harder to attain. Eventually, Dell struggled more and more just to get compensated for the value they delivered and the core competency they held. Today, Dell is a shadow of its former self because they were unable to reinvent themselves in ways the market demanded.

Reinvention is not optional. It is a requirement to stay competitive and profitable.

A counter example to the Dell story is IBM. They are proactively trying to adapt to ever-changing business conditions. Unlike Dell, IBM foresaw the declining trend in the PC industry and divested of it a long time ago by selling their PC division to Lenovo. IBM continued to do this. Right now they are in the process of divesting significant sections of their microelectronic business by selling it to GLOBALFOUNDRIES, formerly the semiconductor division of AMD.

Being proactive about managing change is just a necessary business condition. However, it is not sufficient to guarantee success. How to enable change successfully and, thus, how to win, is where the true magic in business can be found.

After the return in 1997 of Steve Jobs to Apple, we saw an unprecedented success story in change management. Even before Apple’s multiple transformations, we have seen other reformers like Lee Iacocca at Chrysler changing the mode of operation of a complete company. But at Chrysler, and many others, the change that occurred was not sustained and did not become a cornerstone of the company culture.

Apple is the archetype in adapting to new markets. They are extremely proactive in pushing for change, and would rather cannibalize their own product lines to prevent the competition getting ahead of them. This can been seen in the evolution of the various iPod lines, which was the first significant foray out of the core business of personal computing. It was followed up by the iPhone, which is still extremely successful and profitable beyond any expectations.

In all of these transitions and changes, Apple was very deliberate about what it did and which products it brought to market. The original Macintosh, introduced in 1984, was running on a Motorola processor. At the time that might have been a good choice. However, over time Motorola could not compete with Intel, and Apple was nervously sweating it out.

In response to Intel’s dominance, Apple created a partnership with IBM and Motorola, called AIM, whose charter was to derive technology from IBM’s workstation processors in order to create a new generation of RISC CPUs to power the Macintosh line, which was called the PowerPC. One amazing aspect of this transition was that Apple kept the code base and existing software fully functional, without losing the support of third-party software companies.

For a few years this actually worked. But after some time Apple again found itself in the same dilemma - AIM could not compete with Intel in the CPU business. Consequently, Apple did the unthinkable and switched the processor architecture for the second time, now from PowerPC to the x86 platform. And, the craziest part about this is that they survived both complex transitions, including the sustained support from key software application vendors such as Microsoft!

In more recent history, Apple has made other bold decisions and come out on top. The original iPhone was powered by an SoC (the most important component of the hardware) developed by Samsung. However, Apple quickly realized that the SoC is a key part of the product puzzle that it needs to keep control of in order to stay competitive. They did not want to be dependent on Motorola, IBM, Intel, Samsung, or anyone else for a key component of their flagship product again. This made perfect economic sense, since the high volume of iPhone sales is in a totally different cost and profit ballpark than Mac sales.

Thus, Apple went ahead and acquired a few small CPU houses that develop chips using ARM CPU cores. They integrated those companies very quickly and are now themselves transformed into a formidable SoC development house. In fact, Apple pioneered 64-bit SoCs in the mobile market, and they managed to make their SoC in the iPhone 6 the fastest mobile SoC in the market.

When I hear business analysts or car industry experts say that Apple will not be able to develop an automobile, it shows me that they really do not understand this company and its potential. The core of their misunderstanding is that they believe that cars are made primarily from metal and, therefore, the core competency in car development ought to be mechanical engineering and heavy industrial manufacturing. But, remember, what you don’t develop in-house you can buy, or you can team up with a partner.

This assumption might have been true years ago. But cars today are no longer predominantly mechanical devices. They are dominated by electronics. Most car manufacturers are still very slow to understand this and to change their approach to business. And, if they do not adapt quickly, their competitiveness will change in fundamental ways because if it is not Apple, it will be another company that will bring their electronics, and system and software integration expertise, to play to give established car manufacturers a real run for their money. This is the main point of the car product puzzle – There will be electrons!

After this transition, some car companies will be shadows of themselves, and might not survive the transformation. Others will wake up to this new competition and transform themselves in order to stay in business. Market forces will bring about this change on a significant scale.

Apple made the decision to develop their own mobile SoCs. They also write their own operating system and application software. They only buy parts that are not key to differentiation. If Apple decides to step into the automotive space they will bring their core competencies into play. They transformed OS X from a PC operating system (OS) to a mobile OS, and this was not just an adaption. They will create, or derive, an OS for the car and they will develop and integrate the key car SoCs and software technology themselves.

No matter what Apple decides to do and how to do it, the car industry had better watch out. Electronics and software are the key for future innovation in most spaces, and in particular in the car industry.


Axel Scherer

Twitter: @axelscherer


Don’t Lose Extra Simulation Cycles

$
0
0

After reading the rest of this blog, you might guess the truth, which is that my "designing" skills go back to the 8086 processor! In this blog, I have used a 64-bit register (Well, I could make it 16-bit, but…)  in the example, just to show that this issue is still relevant today.

At any rate, the e verification issue that I describe here seems to be a common issue for many users.

Assume that, in the e verification code for a CPU HDL model, you read a general-purpose register with a 64-bit width (r0) and compare its value to a value computed in an e reference model. In other words, your e code contains a port declaration like the following:

r0: in simple_port of uint(bits:64) is instance;

keep bind(r0,external);
keep r0.hdl_path() == "dut.cpu.r0";

Assume also that bits 0 to 8 of r0 are used as status bits—that is, carry, overflow, parity, and so on. They are updated when a given arithmetic operation completes and reset when a new operation begins. Completing the arithmetic operation might take a couple of clock cycles. Naturally, you will want to avoid checking the status change on each clock cycle. You will also want to avoid checking each change in r0.

To achieve this, you might try:

event r0_event is change($r0)@sim;

However, this code will almost certainly NOT work because Specman supports events on objects up to 32 bits. Even if it does work, it results in your checking code being triggered on each change of bits 9 to 63--not exactly what you intended.

What you want is to make your verification check take place only on a status change. The way to do it is to define a port linked to the required slice, such as:

r0_status : in simple_port of uint(bits:9) is instance;
keep bind(r0_status,external);
keep r0_status.hdl_path() == "dut.cpu.r0[8:0]";

And also define an event like:

event  r0_status_change is rise(r0_status$)@sim;

Finally, your verification code might look like:

type status_bit : [carry,overflow,parity=0b00100000];
verify() @r0_status_change is {
        var status := r0$[8:0].as_a(status_bit);  //Note that Specman interface optimizations are used and 
        var data := r0$[63:9];                                // register r0 is accessed only once in a simulation cycle

        case status {
                [parity]: { do_something_with_data(data);};
        . . .

As you can see, going far back to an example from the '70a can still be helpful these days.

Roman Shenkar
e Interface team, Specman R&D 

What Does It Take To Satisfy Your Need For Verification Speed? You Gotta RAK It!

$
0
0

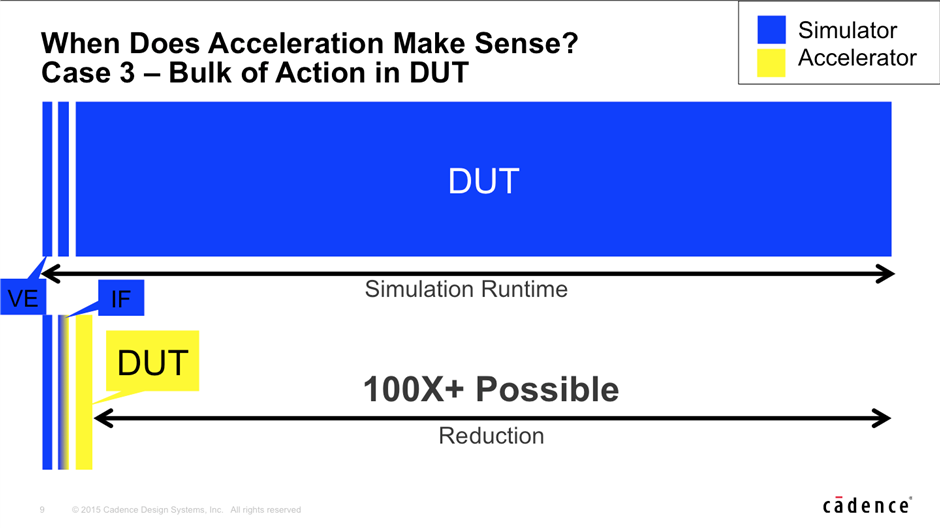
A few weeks ago I discussed how bigger is (often) better. Obviously, everyone has a need for “more cowbell” as well as a need for speed. The questions to ask are:

  • What do you have to do to accelerate your simulation runs?
  • What are the basic factors to consider?
  • How do you have to think about your testbench/verification environment and your DUT?
  • What aspects really matter and what improvements can you expect? 

All of these questions are answered in an introductory Rapid Adoption Kit (RAK) to Verification Acceleration. This RAK provides you with the following collateral:

  • An application note that explains the various relevant factors.
  • A presentation that shows the basic concepts of verification acceleration.
  • A video that is a narrated recording of the slides in the presentation.
  • An example that shows three basic cases and starting points, respectively.
  • A second video that walks you through the example. 

The simulation example also has performance profiling enabled so you can see the speed up that you can expect when moving to acceleration with the Palladium XP platform.

Accelerate this!

Axel Scherer, Chief Velocity Guy

In New York–Boston/Brighton–Mountain View: Modern Formal and Simulation Education

$
0
0

Growing up in the '80s can damage your memory – particularly when it comes to bad music.

At DVCon 2015 in San Jose I spoke with Michael Theobald, PhD, who is an adjunct professor at Columbia University, and he told me about the Columbia campus in New York City, which I have never visited. Immediately, the awful song: New York - Rio -Tokyo came to mind and now it is stuck in my head (Google it at your own risk – you have been warned.) Consequently, I decided to transform this song title into the title of this blog post.

When Michael teaches his students about formal analysis, he puts his verification approach in context, and in particular, when he talks about formal analysis for hardware verification.

He told me that he recommends that his students to check out the Functional Verification course CS348 at Udacity, which was developed by Cadence. As of now, over 17,000 students have enrolled in this specialized course.


(Please visit the site to view this video) 

So what does all of this have to do with the cities listed in the title: New York – Boston/Brighton Mountain View? It’s easy:

  • New York is the location of Columbia University
  • Boston is where yours truly lives; actually in a suburb of Boston
  • Brighton, UK is where my colleague and co-instructor Hannes Fröhlich lives
  • Mountain View is where Udacity is located


Michael, Hannes, and I share a passion for great education. Hannes and I are happy to see that Michael can leverage our work to expand the skills and knowledge of his students.

Also, I am happy to educate you not only on the concepts and technical aspects of verification, but also on “important” aspects of our modern culture. For example, the chorus of the original New York-Rio-Tokyo lyrics are:

In New York - Rio - Tokyo
Or any other place you see,
You feel that dancing fantasy.

The 2015 version of the song should go like this:

In New York – Boston/Brighton – Mountain View
Or any other place you see
You feel that verification methodology.


Keep on learning!


Axel Scherer

Moore’s Law 2.0—The End and Beginning of a New Era!

$
0
0

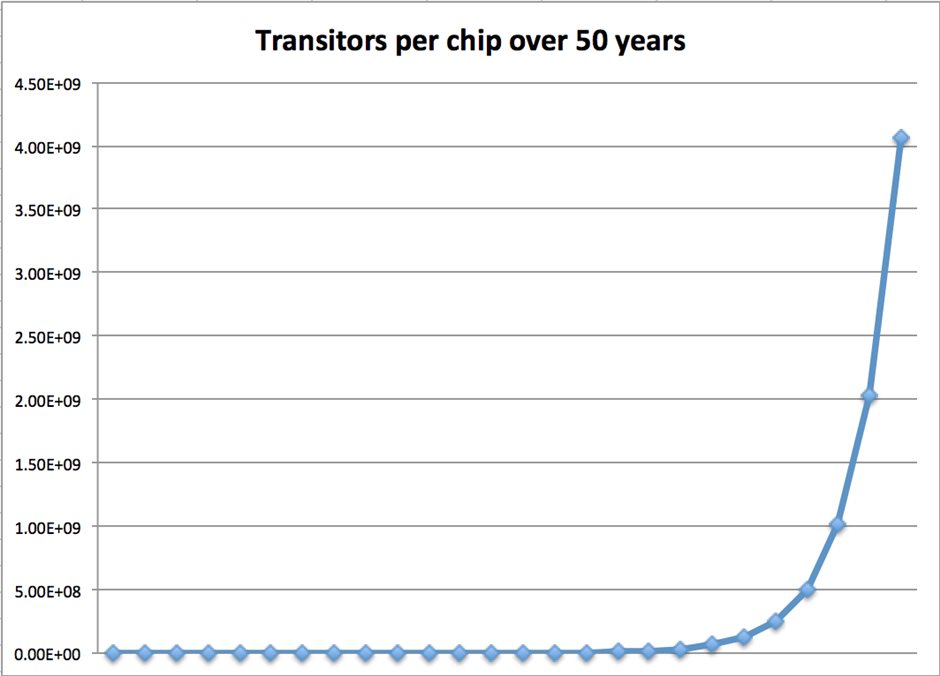
April 19 marks the 50th anniversary of Moore’s law. This is not just a very significant anniversary for technology, but for all of mankind. 

Here is why. We have never before seen such explosive innovation on such a massive and sustained scale.

Let me break it down. Gordon Moore formulated his vision about semiconductor complexity explosion in 1965. Originally, he predicted a doubling of the number of components on a chip every year. Later he revised it to occur every two years.

What does this mean when we compare 1965 to 2015?

It means 225 = 33,554,432

In other words, we have witnessed a 33 million-fold explosion in terms of transistors in an integrated circuit (IC). Today, the largest ICs count transistors in the billions!

For example, Intel’s latest 15-core Xeon Ivy Bridge-EX has over 4 billion transistors.

In no other field of human undertaking have we seen such a long stretch of exponential growth. It is absolutely astounding.

Furthermore, in no other field can you predict that the complexity and its associated application potential will double every two years!

However, we are standing at an inflection point. Moore’s law, let me call it Moore’s law 1.0, will most likely reach its end within a decade. The main premise of Moore’s law is driven by how many components can be packed on a chip. In Moore’s law 1.0 we dealt primarily with a two-dimensional area – the width and length of silicon structure to be manufactured. The latest process size is 14nm. The next-generation process size will be 10nm and 11nm, respectively.

Why are even smaller structure sizes a problem, and why can we not go significantly into the sub-10nm space?

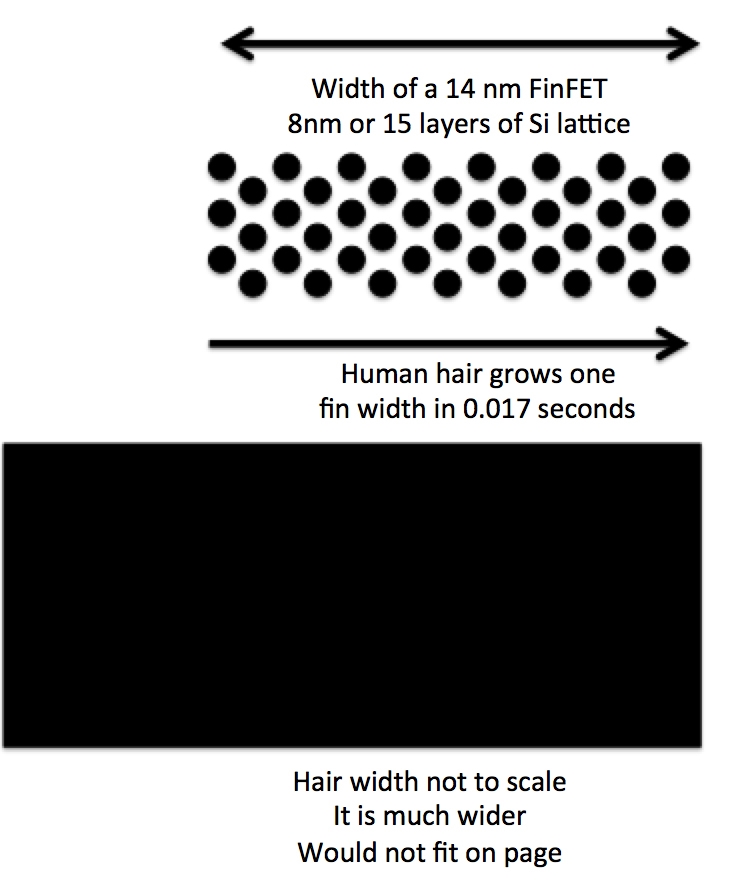
It comes down to the size of the silicon atom and the associated silicon lattice. The lattice parameter alpha for silicon is only about 543 picometers. This means we are dealing with only about 18 layers of Si for a thickness of a 10nm wide lattice. However, with modern transistors things are even smaller as we are now using FinFET technology. The fin width in a 14nm process transistor is actually only 8nm! This is equivalent to about 15 layers of silicon lattice.

At the sub-10nm level, electromigration, and process variations in manufacturing, amongst other effects, will be so large that the end of conventional silicon chip manufacturing at high yields and chip longevity might be reached.

However, we have a way out of this predicament. The solution is to build up.

If we cannot make it 2D anymore, let’s make it 3D. Think about Manhattan, in New York City. When 2D space gets tight you build up into 3D space. The same thing is occurring in semiconductor manufacturing.

Indeed Samsung recently announced a new type of Flash memory: V NAND Flash memory that stacks 32 component layers (up from 24) on top of each other, creating much more capacity per chip than has ever been seen before.

The geometric regularity of memory elements lend themselves perfectly to this kind of application. But we need more than densely stacked memories. We need CPU cores, GPU cores, controllers, bridges, and so on.

From a manufacturing perspective, Moore’s law will go into the Z-dimension to achieve its gains. However, from a computing perspective, the new paradigm will be massive parallelism. The only way to increase compute power is to leverage parallelism because we cannot increase clock frequency much further. The end of conventional silicon manufacturing will force us to go this direction. Subsequently, software development will need to adapt to take advantage of ultra-multi core computing. Ultra-multi core means initially hundreds, but soon thousands of cores and more.

Conventional multi-threading won’t be enough and parallelism will no longer be for special applications or subsets of application. It will be the heart of compute speed, and any application with a need for high-speed computing will need to adapt to it.

Intel and ARM-based chips have been multi-core for years. In fact, you can hardly buy a high-volume, single-core CPU any more.

But those multi-cores all live in two dimensions. In the 3D world we will see a core explosion.

Today you can buy an off-the-shelf 15-core, high-end Intel Xeon chip. Imagine if it was fabricated in 32 layers and you now suddenly have 480 cores on the chip! This is a different beast altogether and will change hardware and software development dramatically.

Moore’s law 2.0 will be about component layers and the associated number of cores!


Axel Scherer

Chief Parallelism Guy


Moore’s Law 2.0–How Small It Is To Be A 14nm FinFET

$
0
0

Moore's Law 14nm finFET

As I mentioned in my Blog on April 7, Moore’s law will turn 50 on April 19. What I did not emphasize enough in my discussion on silicon process evolution is size, or more accurately tininess.

In that post, I stated: “The fin width in a 14 nm process transistor is actually only 8nm! This is equivalent to about 15 layers of silicon lattice.” 

But most people can not fathom what 8nm actually means. It is much smaller than you would assume. It truly is at the atomic scale, and the atomic scale is small beyond belief.

Let’s put a common reference point into place for it: the width of a human hair. It is about 75 μm (micrometers) on average. So how many 8 nm fins would you need to put side by side to match a human hair? It is 9,375 fins! 

Another way of looking at this is speed. Human hair grows at about 1.25 cm per month. This means about 42 μm per day or 1.7μm per hour. 

Moore's Law hair width comparison

So the question is how long would it take for a human hair to growth the width of a 14nm FinFET fin (8 nm).

It would take only 0.017 seconds! How fast is this really? The blink of an eye takes about 0.35 seconds. Hence during the time it takes to blink, your hair would grow the length of about 20 times of the width of a 14nm FinFET fin.

Now this is what I would call tiny!

To hammer down the point let’s look at one more comparison. In 1971, the common structure size was 10 μm. This was also the year when the Intel microprocessor 4004 was released and transformed the entire industry. If we form a square of 10 μm x 10 μm, we get 100 μm2. We need to take into account that a single transistor in 10 μm technology is much larger than 100 μm2. The Intel 6T SRAM cell in 14nm FinFET is 0.0588 μm2. This means a 10 μm square could fit 1,700 bit cells or 10,204 transistors. 

Keep on scaling!

Axel Scherer

Related stories:

-- Moore’s Law 2.0—The End and Beginning of a New Era!

Top 10 Common Questions Regarding New Cadence Indago Debug Platform

$
0
0

By now, you all must have read the news that Cadence has unveiled the new Indago™ Debug Platform, which boosts debugging productivity by up to 50%.

What's the secret sauce between the productivity gains from Indago? Three key features:

  1. Patented root-cause analysis (RCA) technology to automate debug process and analysis to find source of bugs faster
  2. Big Data concepts applied to hardware verification for intelligent debug and increased automation
  3. Integrated debug solution scalable from IP to SoC level.

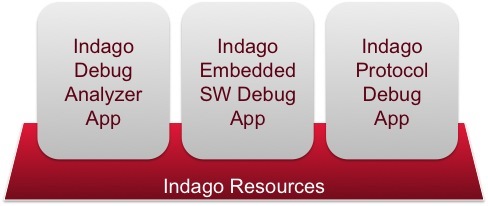
In addition to the open Indago Debug Platform that supports Cadence and third-party verification engines, Cadence also announced three Indago platform Apps addressing specific debug tasks:

  • Indago Debug Analyzer App: Synchronized RTL design & testbench verification
  • Indago Embedded Software Debug App: Enables embedded HW/SW software debug
  • Indago Protocol Debug App: Interface protocol functional validation

For additional info on the Indago Debug Platform and the debug Apps, click here.

Here are some answers to common questions about Indago.

  1. Question: What advantage does Indago RCA have over tools that claim RCA capabilities?

    Response: Indago adds patented intelligent guidance and automation to finding bugs leveraging the Big Data concept. Other RCA tools provide a set of manual features that require upfront educated guesses as to where to sample debug data and after sampling, engineers can only debug the data points that they had the foresight to sample. In most cases, the root cause of the bug is not detected because engineers did not collect the right debug data to perform RCA. The advantage with the Cadence solution is that we apply RCA techniques to RTL as well as TB by leveraging the Big Data concepts to capture all the relevant design data. Engineers can easily step forward and/or backward in time starting from RTL and stepping back to TB. The Cadence RCA solution enables the engineer to find the underlying source of the bug in far fewer iterations.

  2. Question: What does Big Data have to do with debug?

    Response:Debug is a Big Data problem because engineers are trying to find a small amount of critical information within the massive volume of verification engine data. Big Data helps engineers to:

    • Record messages, waveforms, source execution order, call stack, active threads, local variables, etc. in one verification iteration
    • Analyze and play back simulation as well as ask deeper questions about what really happened during the run
    • Highlight correlations that would otherwise go unnoticed in sampling-based debug.
  3. Question: Cadence announced three Indago Apps. Are there more planned for the future?

    Response:Yes, we definitely do have plans to announce more Apps to address other debug tasks. Stay tuned. Indago Apps are sophisticated applications that provide automation for notoriously time-consuming debug problems within the IP and SoC verification process. Engineers also want to build smaller scripts that present information in a particular way within the GUI. Indago plug-ins provide this capability and we provide more than 80 of these.

  4. Question: What do you mean by third-party support?

    Response:The initial third-party debug support is a set of libraries built on the IEEE 1800 SystemVerilog VPI standard so that it will work with all of the verification engines that implement the standard. With it, users can record basic datatypes and it will be extended in the future. The Protocol Debug App has complete third-party support available now.

  5. Question: What are the advantages of post-process software debug?

    Response:The advantages all result in productivity improvements in the time to resolve bugs. Post process debug provides a complete context of the software execution, view of memory from the software perspective and the ability to create custom visualization for faster debug. This is just from the software perspective; add to this a fully accurate and synchronized view of hardware with the software without any instrumentation side effects gives post process software debugging clear advantages.

  6. Question: What is HW/SW debug and why does it matter?

    Response: For hardware-dependent software, the most challenging bugs are typically found at the interface between the hardware and software. These include issues like software race conditions that are created by variable software execution speeds based on processor workloads meeting the variable hardware response times impacted by bus and interconnect traffic. Issues like these that are found under certain loading conditions can be among the most difficult to debug because many debug approaches are intrusive and to provide visibility they impact the traffic or execution speed which can cause the problem to disappear. This is a key reason that post-process debug saves time on finding and fixing these type of HW/SW dependency issues by giving a fully accurate and synchronized view of both the hardware and software activity and the ability to visualize both in the context that makes sense, waveforms for hardware and source code for software. With the growth in use of software for verification, post-process hardware and software debug is becoming a must-have tool for development.

  7. Question: Who can benefit from the Incisive Protocol Debug App?

    Response: All engineers tasked with verifying IP and SoC designs incorporating standard interfaces such as ARM AMBA, DDR, MIPI, etc.

  8. Question: How does the Indago Protocol Debug App help the engineer?

    Response: It provides a protocol-specific view of the simulated interactions between a design and verification IP (VIP) to illuminate the root causes of interface bugs.

  9. Question: What form does the protocol-specific view take?

    Response: Four views are provided: the Channel Viewer, State Machine Viewer, Smart Log, and Life Story:

    • Channel Viewer
      • Graphical presentation of transactions clarifies design behavior
      • Select data types or packets to see preferred level of detail
      • Error highlighting reveals design bugs
    • State machine diagrams relate design behavior to specification terminology
      • See what states were visited during simulation
      • View reasons for state changes and see event timing
      • Drill down to lower-level state machines
    • Smart Log
      • Set up multi-level queries to save and share
      • Warnings and errors highlighted and connected to relevant packets
    • Life story
      • See everything that happened to a given object during simulation
      • View registers, packets, state machines, lanes, queues configuration space, etc.
      • Filter history to focus on important events
      • Merge object histories from multiple simulations.

  10. Question: Is there any collateral available on the Indago Debug Platform and the debug Apps?

    Response: Yes, check out the Indago Debug Platform landing page, where you can download the White Paper, App Videos, details on each of the three apps, Blogs, etc…

If you have any other questions about debug or Indago Debug Platform, send them my way!

Kishore Karnane (karnane@cadence.com)

Related stories:

-- Indago Debug Platform—Automating Root Cause Analysis and Leveraging Big Data

-- Eliminating the Kafka-esque Nightmare of Bugs (Video)

The Time is Ripe—SystemVerilog Adoption for Design Is Gaining Momentum

$
0
0

On March 2, 2015, I had the privilege of moderating the Accelera tutorial at DVCon San Jose, which focused on the adoption challenges and the benefits of using SystemVerilog for design (SVD).

The consensus was that, although it has been 10 years since the ratification of IEEE 1800, we are finally seeing momentum in the adoption of language features that are extremely beneficial for modeling designs. In the verification arena, many features have been adopted quickly for two reasons: the productivity gap was very high and the adoption challenges were lower. However, in the design space, the adoption challenges are much higher. This is because a much larger set of tool types and vendor implementations must consistently support the same subset of the language in order to work productively.

In the tutorial, we heard from Stu Sutherland of Sutherland HDL, who talked about the use of SystemVerilog assertions (SVA) in the design space.

Junette Tan followed up by describing how PMC Sierra mounted a concerted effort, starting in 2010, to adopt SystemVerilog for design. She explained the challenges and the gains the company made by being an SVD pioneer. We captured a short video with Junette to summarize her talk.

(Please visit the site to view this video)

Then followed Mike Schaffstein, who illustrated the methodology he deployed to pilot SV for design at Qualcomm. He discussed the methodology and the SV constructs that work, and where the remaining challenges lie. Mike spoke in the video below about his experience.

(Please visit the site to view this video)

Finally there was a panel discussion that also allowed the audience to ask more questions. Overall, this session was very well attended, and as far as I know, it was the most heavily attended session at DVCon this year. As a benefit, the discussion and audience interaction was very lively. My thoughts on this tutorial are summarized in this video. 

(Please visit the site to view this video)

The subsequent DVCon survey results showed that the vast majority of the attendees were inspired and excited by the tutorial, and many expressed their intent to start adoption of SystemVerilog for design in 2015.

Axel Scherer, Chief Tech Adoption Guy

Twitter: @axelscherer


Specman deep_copy()—Creating Too Many Structs

$
0
0

This blog starts with a description of a debugging session of a mysterious behavior we encountered. Unlike a good mystery book, I will tell you upfront who did it—deep_copy(). In the second part of the blog, we’ll recap e’s copying methods, and we’ll understand how to avoid such mischief.

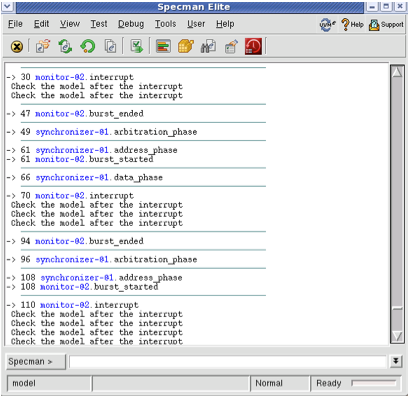
The mystery started when we saw that, in one verification environment, a struct that was expected to perform a check after every interrupt performs this check suspiciously too often.


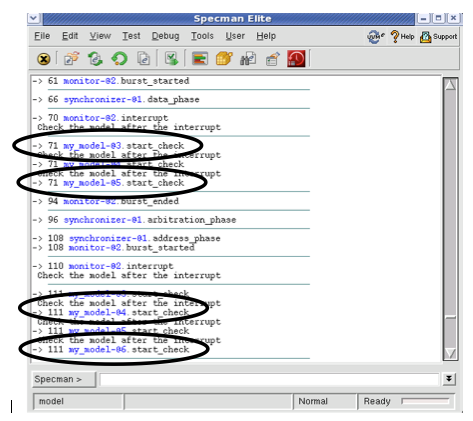
To get more information of what’s happening, we issued an echo event command on the event triggering the check, start_check. What we saw surprised us—it’s not that there is a struct performing many checks—we have many instances of this struct running in parallel. But we were sure we had instantiated this struct only once… where were all these instances coming from?

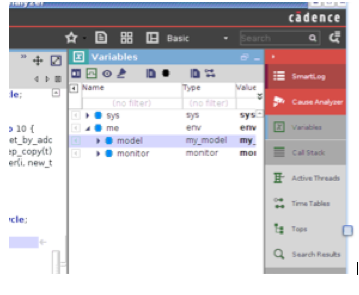
We probed the run using ida_probe, and decided to take a look at the env with Debug Analyzer. As you can see in the screenshot, there is one field of the type my_model under the env, as expected. So, what are all the other instances?


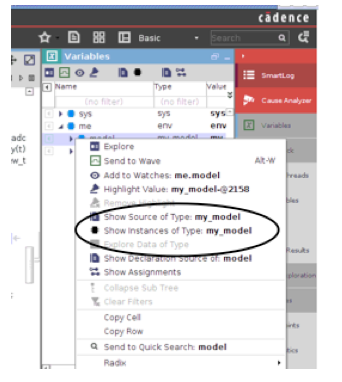
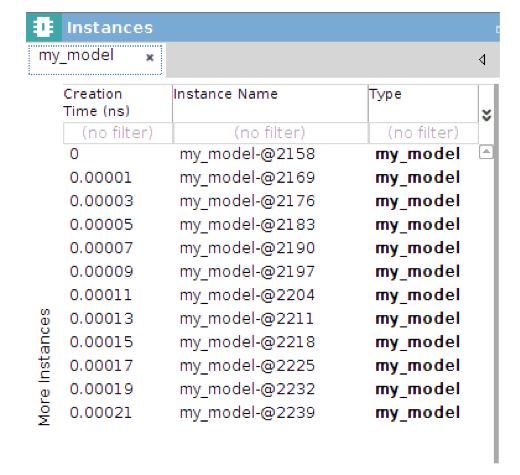
When we requested to view all instances of this type, we saw that a new struct of that type is created every few cycles.

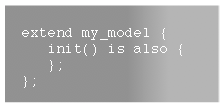
Who created all these copies of my_model? And why? There is an easy way to find this out—we created a small file, extending in it the my_model struct:

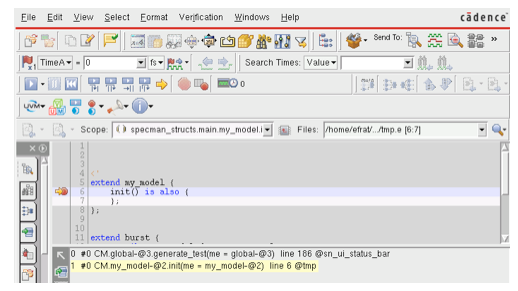
The only reason we added this code, was to ensure my_model.init is implemented, so now we can set a break on it: “breakmy_model.init”. We ran the test again, and looking at the Callstack in the Source Browser:

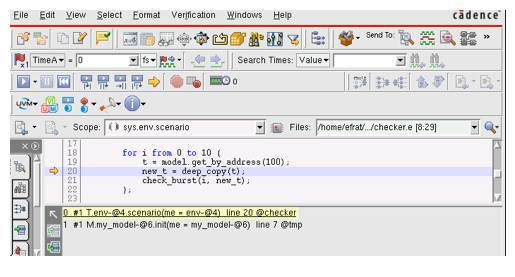
Going up one level in Callstack, we can see who caused the creation of the my_model– a deep_copy().


 To understand what happened here, let’s recall how copy() and deep_copy() work. When you copy a struct using copy(), the scalar fields are copied with simple assignments. As with “new_struct.field = original_struct.field”. Fields that are lists or structs are not duplicated, rather the reference is copied.

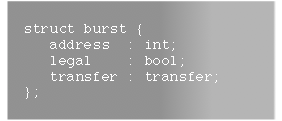
If we take this struct, for example:

Then coping a burst, the result will be a new burst struct, with the values of its address and legal fields identical to the original fields, and its transfer field is a reference to the same transfer sub-struct of the original struct.

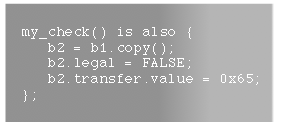
Assume we now do some manipulation on the new struct, b2, like this:


This will result in:

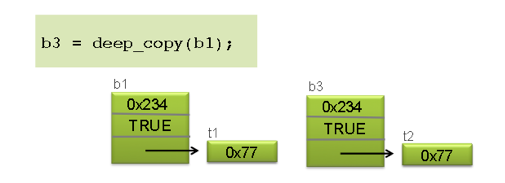
If we want to avoid such a behavior, the new burst struct must have “its own copy of transfer”, so it can modify it without interfering with b1, the original struct. This is what deep_copy() is for.This routine performs a recursive copy—each field is copied by value. 

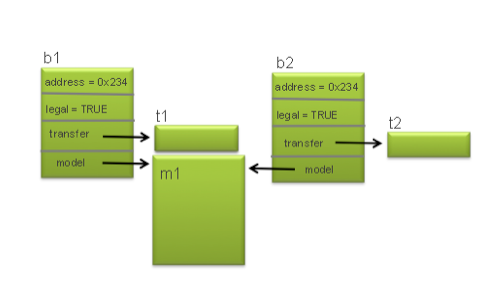
Now we can modify any of b3 fields, including fields of b3.transfer—without affecting the original struct, b1. Going back to our “buggy environment”, with all the instances of the my_model—the burst struct is copied using deep_copy(), because the checking method modifies the transfer sub struct. But burst also has a field that is a reference to my_model—so with deep_copymy_model is deep copied as well.

So? What can we do? We do not want to use copy(), because then altering the burst.transfer has undesired side effects. But using deep_copy() creates all these copies of my_model, which also has its side effects.

In such cases, deep_copy() is the approach. What do we do about it copying the my_model? Not problem—we can instruct it not to do so, using field attribute:

So now, most of the fields—including transfer—are deep copied, and for my_model field—the reference is copied.

As you can see, you can code what you want, getting deep copy, shallow copy, or a mixture. Just decide what behavior you want to achieve, the features are there.

Detailed information about copy(), deep_copy() and field attributes is available in CDNSHelp.


Enjoy verification!

Efrat Shneydor

Multi-Language Verification Environment—Getting First Run in Few Minutes

$
0
0

Seems that by now, every one in the industry realizes that multi-language verification environments are not a faraway vision, something only for eccentric verification experts. Multi-language is here, simply because we need it.

Because there is no sense in throwing away a high-quality verification environment just because someone else prefers coding in a different language. Because there is no sense in forcing engineers to work in a language that does not fit best their needs and knowledge. Because you keep integrating your environment with verification packages developed elsewhere—do you really want to develop everything from scratch? 

In this blog, I’ll try to convince you that creating a verification environment by combining components implemented in different languages is much simpler than you might think.

Let’s start with a simple use model. For the sake of example, assume your next project requires UVCs implementing two protocols: XSerial and UBus. Your company has such UVCs, but the XSerial UVC is implemented in e, and the UBus UVC is implemented in SystemVerilog. 

I recommend creating the environment in steps, especially when it is your first multi-language environment.

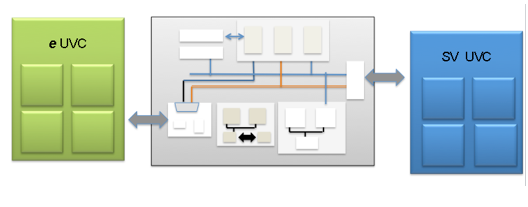
The first step would be to create a verification environment in which the SystemVerilog UVC and the e UVC run side by side, each exercising one i/f of the DUT, without any interaction between the two UVCs. In this first step, we just confirm that the UVCs can coexist. The environment we build is of architecture similar to this:

For creating such a verification environment there is no need to modify your code, or to use any special tools or libraries. Just compile the UVCs and the DUT RTL together.  

irun sv/ubus_top.sv e/test_1.e dut_top_file.v <options>

The <options> are the regular irun options we use when running e or SystemVerilog environments: uvmhome flag (required for using UVM SystemVerilog),  timescale, incdir, etc.

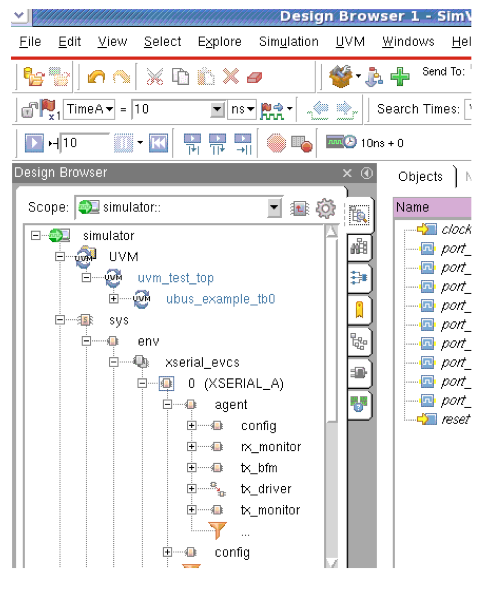
Now we have a simulation in which the two UVCs run side by side, as you can see in the screen shot below. The SystemVerilog components are instantiated in the normal UVM way, under uvm_test_top, and the e components are instantiated under sys. In this environment, each UVC is sending data to and from its designated interface, without any synchroniation between the UVCs—no synchronization of configuration, traffic control, or system-level checks.

This is the first step of creating a multi-language environment, quite quick to implement, which gives a preliminary confirmation that these two UVCs can coexist. Now we can start enhancing the verification environment, adding interactions between the UVCs. Some examples of such interactions:

  • Pass data items between verification components implemented in diffetent languages, using TLM ports
  • Configure a component from a component implemented in a different language
  • Implement multi-language sequences with a virtual sequence in one language, do’ing sequences implemented in another language

A basic synchronization of e and systemVerilog can be implemented by connecting e ports to registers in SystemVerilog modules, and you can even call SystemVerilog tasks from e code. For connecting UVCs implemented in e to UVCs implemented in UVM SystemVerilog—in classes—we will start using UVM-ML.

The next blog, Multi-Language Verification Environment—Passing Items on TLM Ports, Using UVM ML, will shows how we add usage of UVM-ML to the verification environment, and will demonstrate implementation of a system-level scoreboard, getting items from monitors implemented in different languages.

Happy Verification!

Efrat Shneydor

Multi-Language Verification Environment (#2) – Passing Items on TLM Ports, Using UVM ML

$
0
0

In the previous blog post, we created a simple multi-language verification environment, running UVCs implemented in SystemVerilog and in e.

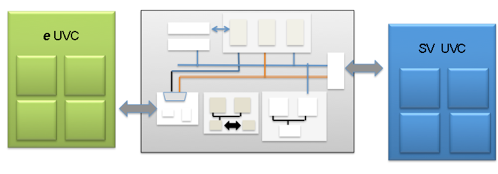
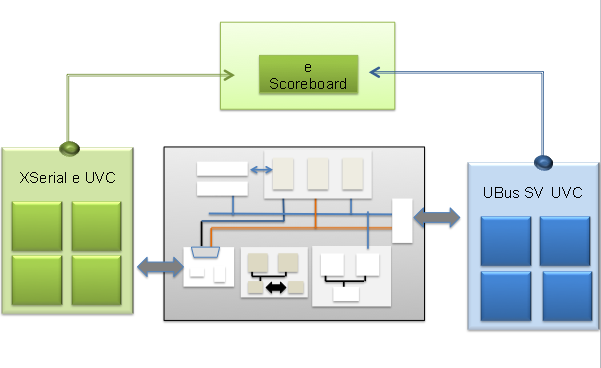
The architecture of the environment is as pictured here:


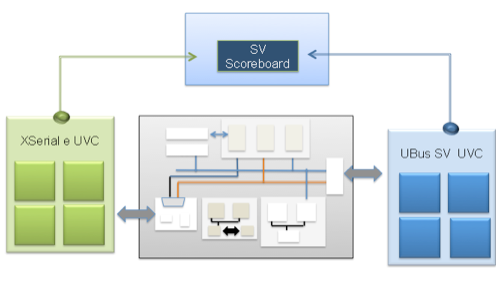
We will now add to this environment a system-level checker, implemented in SystemVerilog.

A standard recommended way for passing items is via TLM ports. For connecting ports instantiated within components implemented in different languages, we use UVM-ML.

  1. If you haven’t already, download and install UVM-ML from Accelera UVMWrold
  2. When compiling the environment, use the required UVM_ML flags. The best way for adding the required flags is using the option files that are provided within the UVM-ML library.

For example, running an environment containing e and SystemVerilog UVCs:

irun ./test.sv \

 -f ${UVM_ML_HOME}/ml/run_utils/ml_options.32.f \ 

 -f ${UVM_ML_HOME}/ml/run-utils/sv_options.32.f \

 -f ${UVM_ML_HOME}/ml/run_utils/e_options.32.f \     

 -uvmtop SV:svtest -uvmtop e:./top.e \

 -exit 


See the UVM-ML User Guide, residing under the docs directory in the UVM-ML library, for the detailed description of compiling multi-language environments. 

Passing structs via the TLM ports is achieved by serializing the transaction content, sending it to the connected port, and de-serializing it there. This process requires two things:

  1. Need to know which type mapped to which type in the other language (known as “type mapping”)
  2. The serialization and de-serialization need to match, in order to get the same transaction on each side

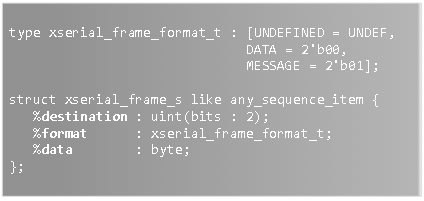
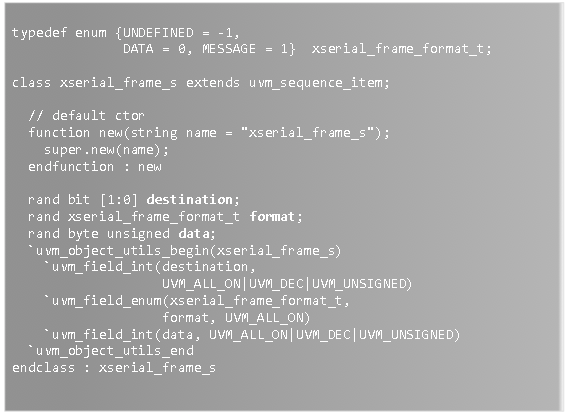
For connecting the e monitor to the SystemVerilog checker using the standard TLM analysis interface, we have to define the required type in SystemVerilog – a struct matching the xserial_frame struct - and implement the serialization and de-serialization. The fastest way to do so is using IES mltypemap stand-alone utility. We provide to it as an input the e code containing the definition of the e struct, and it creates e and SystemVerilog files, containing the corresponding SystemVerilog definition and all the code that is required for passing the struct between e and SystemVerilog.

For example, if this is the definition of the e struct:

Running on it mltypemap will result with this definition in SystemVerilog:

Note how mltypemap defines all the required types,  xserial_frame_format_t in this example. 

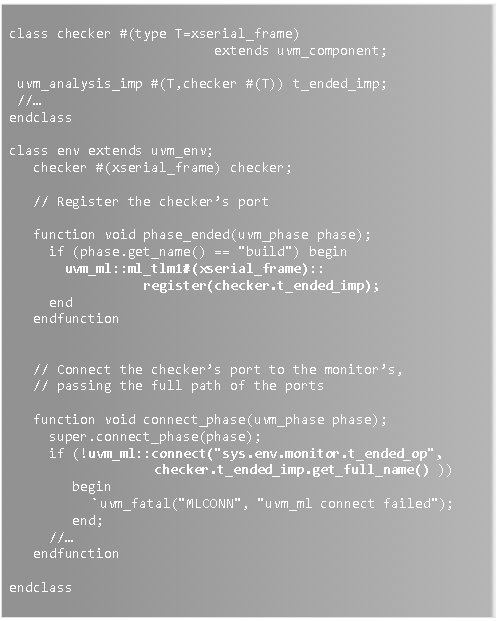
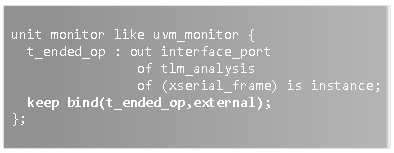
Now that we have a SystemVerilog definition of xserial_frame, we can implement the checker comparing the monitored xserial_frames to the monitored ubus_transfers. All that’s left is to connect the ports of the monitors to the checker’s ports. The connection can be implemented either in SystemVerilog or in e, in this example – we do this in SystemVerilog, using uvm_ml::connect(). Before connecting ports of different languages, the ports have to be registered to UVM-ML. SystemVerilog ports are registered using UVM-ML TLM register(), and e ports should be bound to external.

Connecting the SystemVerilog checker to the e monitor:

SystemVerilog:

  1. Register the checker’s port to UVM-ML
  2. Connect the ports, using uvm_ml:connect()


e:

  1. Bind the monitor’s port to external


That’s it! The e monitor and the SystemVerilog checker are now connected. When the monitor writes frames on the port, the checker will get them.

As you can see, the amount of code required for passing data from e to SystemVerilog is quite small:

  1. Match the types and implement the serialization
    1. mltypemap automates this task
    2. Register the SystemVerilog port to UVM-ML
    3. Bind the e port to external
    4. Connect the ports, either in e or in SystemVerilog, using UVM-ML connect_names() or connect()

You can see a detailed description and examples of passing items via TLM ports in UVM-ML examples, User Guide, and Reference Manual.

For mltypemap, see Specman documentation on Cadence Help.

The next blog post in this series, Multi-Language Verification Environment – Connecting UVM Scoreboard to a Multi-Language Environment, will show a simple way of adding a system-level checker to the environment using UVM e Scoreboard. This scoreboard uses TLM ports as its API, so it can connect to models and checkers implemented in one of the languages – e, SystemVerilog, or SystemC.


Happy verification,

Efrat Shneydor


It’s Time to Modernize Debug Data and It’s Happening at DAC

$
0
0

“The leading edge is 1 million gates.” That was the news when we approved IEEE Verilog 1364-1995 and the open VCD syntax standard for debug data interoperability. Now the leading edge is over 1 billion gates and it’s time to modernize VCD. If you stop by the Verification Academy booth at DAC on Tuesday June 9 at 5pm, you’ll learn how.

Now that I’ve piqued your interest, lets take a look at why we need to do this. In the early 1990s, engineers were running RTL and gate designs on simulators and emulators that generated a large amount of debug data. They needed innovative tools to display and analyze this data, which meant they needed a way to decouple the data producers, simulators and emulators, from these new data-consuming technologies. The open Value Change Dump (VCD) text file syntax was defined for just this purpose. It is a simple means to identify signal names and the time/data pairs associated with them. VCD was then standardized within IEEE Verilog 1364-1995. The 1364-2001 extended VCD (eVCD) with signal strength information but retained the structure of the original syntax.

To say that things have changed is a massive understatement. Designs are 1000 times larger. We have complex test benches with object-oriented data types. We have power. VCD is still used for open interoperability, but the VCD files are too large and process too slowly to be used in most engineering flows. The industry created proprietary binary data formats that serve the data diversity and data size needs, but lost the producer/consumer decoupling that originally drove VCD.

Cadence and Mentor realized that it’s time to get debug data interoperability back. We are working on an open Debug Data API (DDA) to modernize VCD. The API defines a set of read functional calls enabling analysis tools to access binary data regardless of the source. The API will be provided as an open, Apache-licensed source code base so that tool providers can optimize the interface implementation for their tools. Doing so also preserves independence of the optimized binary databases in use today. As a result, the analysis tools can access raw debug data through from these binary databases through a single API with little overhead compared to the direct API associated with each one.

On April 28, 2015 Cadence announced third-party support with the new Indago Debug Platform. This collaborative work with Mentor is another step toward that goal. At DAC, you can learn more about the open DDA, the work completed so far, and the opportunities for the community to help us modernize VCD. Stop by the Verification Academy booth at 5pm on Tuesday to hear more about this collaboration and see a short demo.

Regards,

Adam Sherer

Multi-Language Verification Environment (#3) – Connecting UVM Scoreboard to a Multi-Language Environment

$
0
0

In the previous blog post, we demonstrated connecting a checker implemented in SystemVerilog to a monitor implemented in e.

In this post, we will show a fast way for adding a system-level data checker – using the UVM Scoreboard.  The UVM Scoreboard is an open-source framework, implemented in e, and is released as part of the UVM e Library. 

For adding a scoreboard to our XSerial-to-UBus environment, we define a scoreboard with one add port handling XSerial data items and one match port handling UBus transfers. scbd_port is a macro, it adds to the scoreboard unit a tlm_analysis port of requested type. The following code defines a scoreboard unit getting xserial_frame_s and storing them in the add queue, and when getting ubus_transfers, it searches the queue for a match. 

For passing items using TLM ports, we use UVM-ML –

  1. If you haven’t already, download and install UVM-ML from Accelera UVMWorld
  2. When compiling the environment, use the required UVM_ML flags. The best way for adding the required flags is using the option files that are provided within the UVM-ML library.


For example, running an environment containing e and SystemVerilog UVCs:

irun ./test.sv \

 -f ${UVM_ML_HOME}/ml/run_utils/ml_options.32.f \ 

 -f ${UVM_ML_HOME}/ml/run-utils/sv_options.32.f \

 -f ${UVM_ML_HOME}/ml/run_utils/e_options.32.f \     

 -uvmtop SV:svtest -uvmtop e:./top.e \

 -exit 

See the UVM-ML User Guide, residing under the docs directory in the UVM-ML library, for the detailed description of compiling multi-language environments.

Passing structs via the TLM ports is achieved by serializing the transaction content, sending it to the connected port, and de-serializing it there. This process requires two things:

  1. Need to know which type mapped to which type in the other language (known as “type mapping”)
  2. The serialization and de-serialization needs to match, in order to get the same transaction on each side

For e-to-e ports, all this is implemented automatically. So for passing items from the e XSerial monitor to the Scoreboard, all we have to do is bind the monitor’s port to the scoreboard’s frame_add_p.

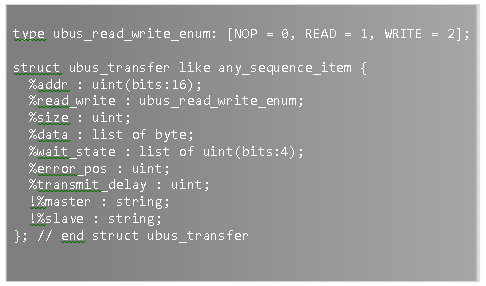
For connecting the SystemVerilog monitor to the e scoreboard, we have to implement the required type –ubus_transfer - in e, and implement the serialization and de-serialization. The fastest way to do so is using IES mltypemap. We run it on the code containing the definition of the requested struct, and it creates e and SystemVerilog files, containing all code that is required for passing the struct between SystemVerilog and e

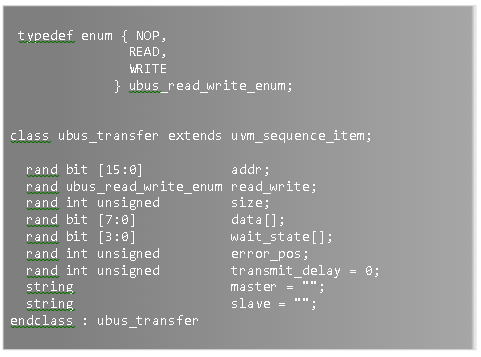
If the ubus_transfer definition is as follows:

Running on it mltypemap will result in this e code:

Note how mltypemap creates conversion also for required type, ubus_read_write_enum in this example.

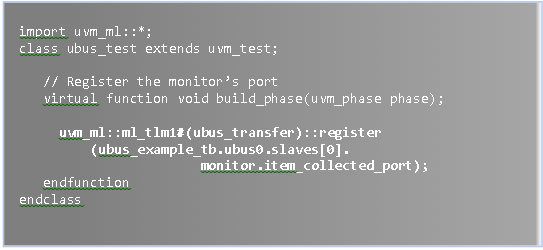
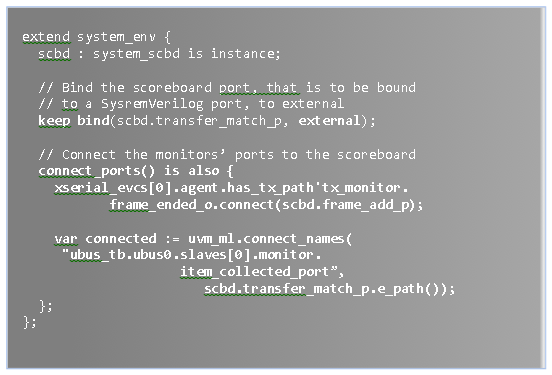
After defining the scoreboard and the serialization code, all that's left is connecting the ports. The connection can be implemented either in SystemVerilog or in e. In our example we implement it in e, using connect_names(). For connecting ports of two languages, they have to be registered. SystemVerilog ports are registered using UVM-ML TLM register(), and e ports are bound to external.

 In SystemVerilog:

  1. Include the UVM-ML library
  2. Register the monitor's port to UVM-ML

in e:

  1. Instantiate the scoreboard
  2. Bind the port that is connected to a SystemVerilog port to external
  3. Connect the ports:
    1. e-to-e ports connect using connect()
    2. e-to-SV ports connect using UVM-ML connect_names()


As you can see, the amount of code required for passing data from e to SystemVerilog and vice versa is quite small:

  1. Match the types and implement the serialization:
    1. mltypemap automates this task
    2. Register the SystemVerilog port to UVM-ML
    3. Bind the e port to external
    4. Connect the ports, using UVM-ML connect_names()


See detailed description and examples of passing items via TLM ports in UVM-ML examples, User Guide, and Reference Manual.

For mltypemap– see CadenceHelp.

In the next post in this series - Multi-Language Verification Environment – Multi-Language Hierarchy – we will show how we can instantiate e units within SystemVerilog components.

Happy verification,

Efrat Shneydor

Viewing all 666 articles
Browse latest View live


<script src="https://jsc.adskeeper.com/r/s/rssing.com.1596347.js" async> </script>